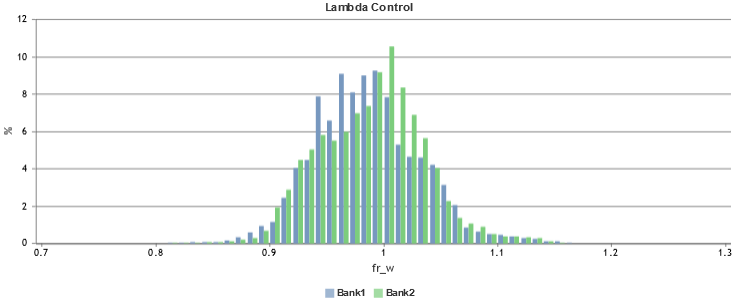
Histogram
Chart type that represents frequency distributions of certain events or values. Only one signal is allowed as input for the x axis. The y axis can be modified by using display types (durationAbs, durationPercent, or steps). For more information, see Display Types.
A subtype of the histogram is "histpie" that represents the data as proportions of a circle.