Traceability Graph
The Traceability Graph page overviews the traceability graph’s functionality.
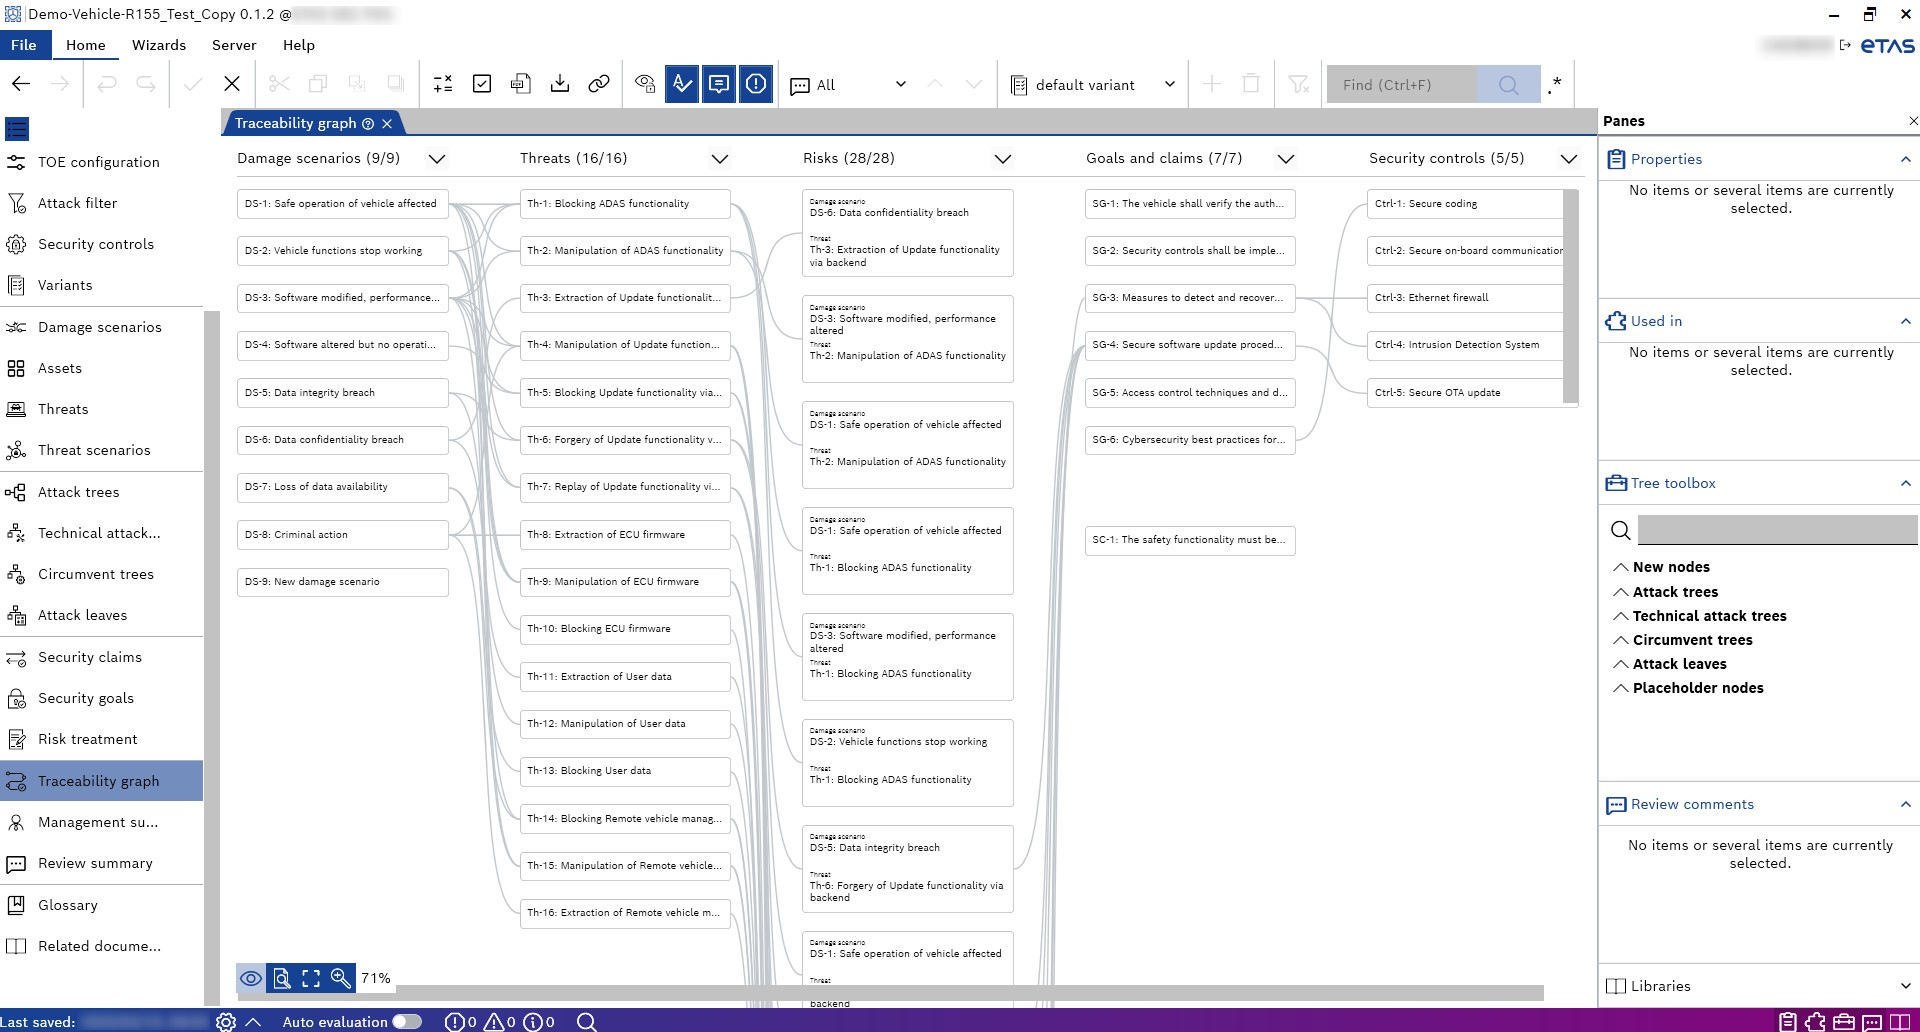
The traceability graph visualizes the relationship of the various TARA artifacts. Via highlighting, the complete relation is presented: Starting from the damage scenarios and the threats (including the assets and their properties) leading to the corresponding threat scenarios and their risks. These risks are then mitigated by linked security goals and claims, which further define the security controls.
You can choose the level of detail of information presented in the traceability graph.
The traceability graph shows the relationship between several artifacts of a TARA. From left to right, the TARA workflow is represented (similarly to the tabs in the project explorer). The relationships/links between the artifacts are shown via the gray connection lines. If one or multiple artifacts are selected, the linked artifacts are highlighted with gray backgrounds, the connection lines change the color from gray to blue.
For example, this may help you to understand which security controls mitigate which risks or which security goals are related to which threats in a TARA.