Parameter <parameter_name>
Parameters / Optimization step > Parameter Window
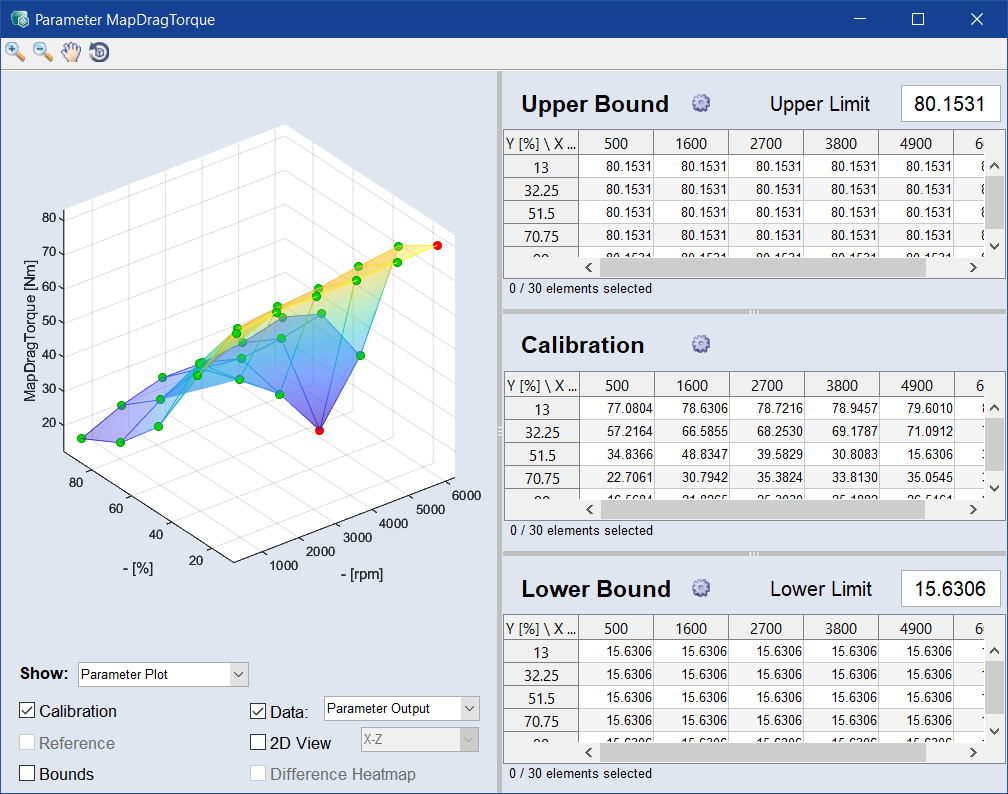
For a curve or map parameter, the Parameter<parameter_name> window can be used to specify global optimization bounds, optimization bounds per grid node, and parameter values. For a 3D or 4D cube parameter, the window can be used to specify global optimization bounds and parameter values.
The Parameter<parameter_name> window contains the following elements:
Toolbar


Plot
Here, the curve or map (![]() )and its bounds (
)and its bounds (![]() ) are displayed. You can drag the grid points to change their values.
) are displayed. You can drag the grid points to change their values.
For scalars, curves, maps, and cubes, the plot area contains the following elements:
For matrices, the plot area contains the following option:
Zero-Indexed View
Displays the matrix in the table using zero-based indexing.
When Zero-Indexed View is activated, the first row and first column are indexed with 0 instead of 1.
Edit
Undo Parameter Change
Reverts the most recent change made to the working parameterset. To step back through your edit history, use multiple times.
To open a list of recent changes and select a step to revert to, click the arrow next to the Undo Parameter Change button.
Shortcut: Ctrl+Z
Redo Parameter Change
Reapplies the last change that was undone. To move forward through your edit history, use multiple times.
To open a list of undone changes and select a step to reapply, click the arrow next to the Redo Parameter Change button.
Shortcut: Ctrl+Y
Show
Parameter Plot/Heatmap
Select whether the parameter is displayed as a parameter plot or as a heatmap.
To visualize the parameter values in the plot area, select Parameter Plot.
To display the data coverage for the parameter, select Data Coverage Heatmap.
Only available for parameter plots:
Activate the corresponding checkbox to show the following information:
- Calibration: Displays the calibration values from the working parameterset.
-
Reference: Displays the parameter from the reference or initial parameterset.
-
When Reference is activated, the parameter value table shows the differences between the reference parameterset and the working parameterset.
See also:Dealing with Reference Parameters
-
-
Bounds: Displays the upper and lower bounds of the parameter (only available for curve and map parameters).
-
Difference
-
Difference Heatmap: Shows the difference between the working parameterset and the reference parameterset as a heatmap in the parameter value table. Red indicates that the current value is greater than the reference value. Blue indicates that the current value is smaller than the reference value.
-
Data: Displays data points in the parameter plot.
-
The data points can show either the output of the selected map or curve, or a selected data channel. To select the data to display, use the drop-down list below. The project signals and the special signal Parameter Output are available.
Parameter Output shows the input signals evaluated by the parameter. This is useful for checking the distribution of the input signals in relation to the selected parameter.
-
-
2D
-
To select which axes are displayed as the X-axis and Y-axis of the 2D plot, use the drop-down list, for example X-Z or Y-Z.
-
For map parameters, values of the third axis can be displayed as connected points in the 2D plot. To display values of the third axis, select the corresponding row or column in the table. To display several curves in the plot, select multiple values with Ctrl, Shift, or click and drag the cursor.
-
Upper Bound
The table contains the upper bound values at the grid points of the curve or map. You can edit the points by double-clicking on the cell.
Use the gear  button to edit the breakpoints of the upper bound. See, Edit Breakpoints of Bounds.
Type a value in the Upper Limit input field to set as upper bound.
Calibration
If Reference is deactivated, the table shows the parameter values at the grid points of the map, curve, or cube. If Reference is activated, the table shows the difference values at the grid points of the map, curve, or cube.
You can edit the values of the calibrated map/curve/cube.
Lower Bound
The table contains the lower bound values at the grid points of the curve or map. You can edit the points by double-clicking on the cell.
Use the gear button to edit the breakpoints of the lower bound. See, Edit Breakpoints of Bounds.
Type a value in the Lower Limit input field to set as lower bound.
See also