Select Axes (Visualization)
Visualization step >View menu>Select Axes
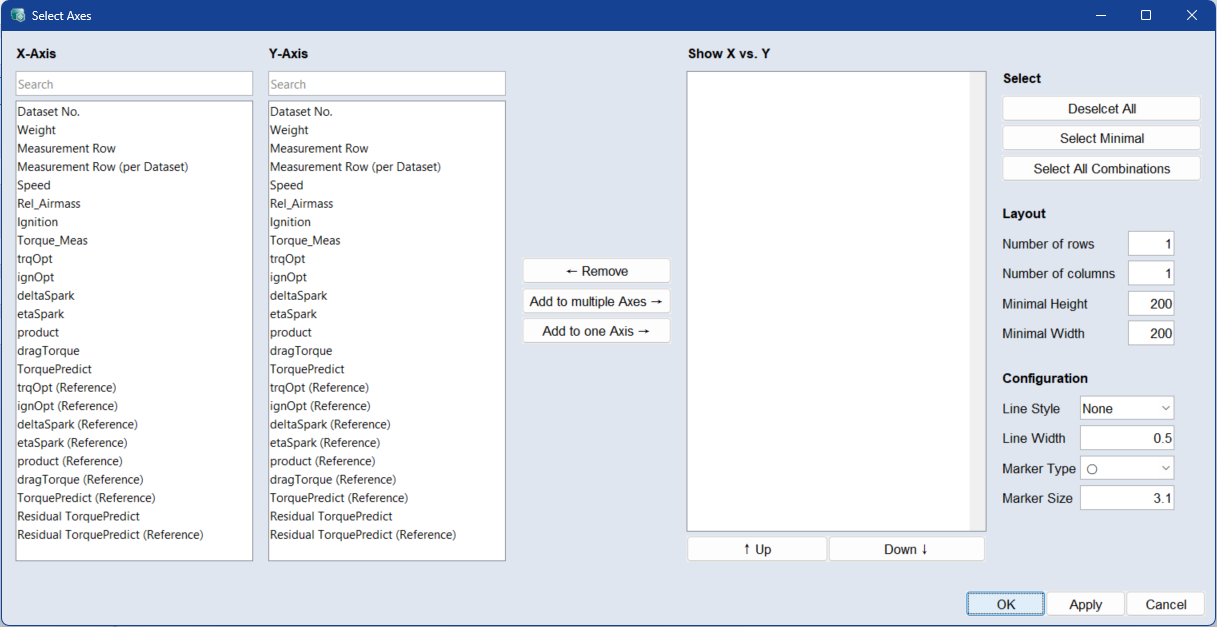
The Select Axes window lets you choose X- and Y-axis variables, configure layouts, and adjust visualization settings before generating plots.
X-Axis/Y-Axis
These lists contain all parameters that can be plotted, for example inputs and outputs of the current project.
In each list, you can select one or more parameters to be used as the X- or Y-axis for a 2D plot. You can use the standard Ctrl/Shift selection functions in the table
Use the Search box above each list to filter parameters by name.
Add to multiple axes / Add to one axis
Adds combinations of each selected X-axis with each selected Y-axis to the Show X vs. Y list.
Add to multiple Axes: Adds all combinations to separate axes.
Add to one Axis: Adds all combinations to one axis.
Existing combinations are added a second time.
Remove
Removes the selected combinations from the Show X vs. Y list.
Show X vs. Y
This list displays all selected X/Y combinations.
Use the Up and Down buttons to change the order of the selected combination. You can use the standard Ctrl/Shift selection functions in the table
Select
Deselect All: Deselects all combinations.
Select Minimal: Selects as many combinations as required so that each axis appears in at least one plot.
Select All Combinations: Selects as many combinations as required so that each axis is plotted against all other axes.
The following combinations are not selected:
-
An axis against itself (e.g. Speed vs. Speed).
-
The inverse of a combination already selected (if Speed vs. Load is selected, then Load vs. Speed is not selected).
Layout
Defines the arrangement of multiple plots.
Number of rows: Sets the number of rows in the layout grid.
Number of columns: Sets the number of columns in the layout grid.
Minimal Height: Sets the minimum plot height in pixels.
Minimal Width: Sets the minimum plot width in pixels.
Configuration
Adjusts the appearance of the plots.
Line Style: Selects the line style for plotted data (e.g., None, Solid, Dashed).
Line Width: Sets the line thickness.
Marker Type: Selects the marker shape.
Marker Size: Sets the marker size.
 OK
OK
Applies your settings and closes the window.
Apply
Applies your settings, but does not close the window.
Cancel
Discards your settings and closes the window.