View Menu
The View menu contains the following entries:
Scatter Plot
The inputs of the experiment plan can be displayed in pairs against each other in  this window.
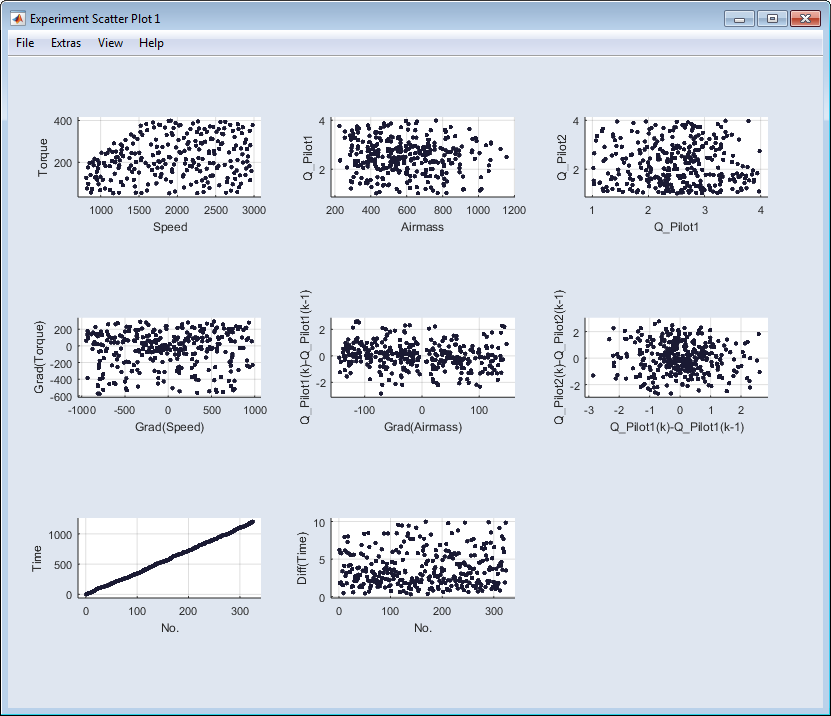
This scatter plot window contains the same elements as described in Scatter Plot .
Density Plot
This window visualizes the dynamic of the experiment plan, by showing the trajectories of the plan. With the lightness graduation of the trajectories you can see the frequency of stay on the different points (the brighter the point is plotted, the higher is the frequency of stay). The visualization is independent of the time.
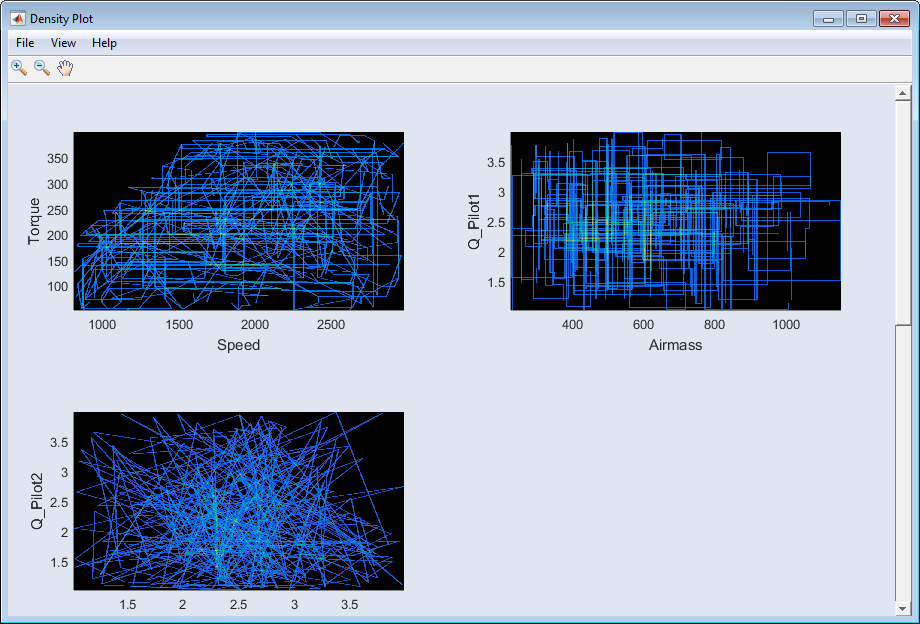
See "Density Plot" Window for a description of the window elements.
Scope View
In this window, the dynamic test plan is represented with a timeline.
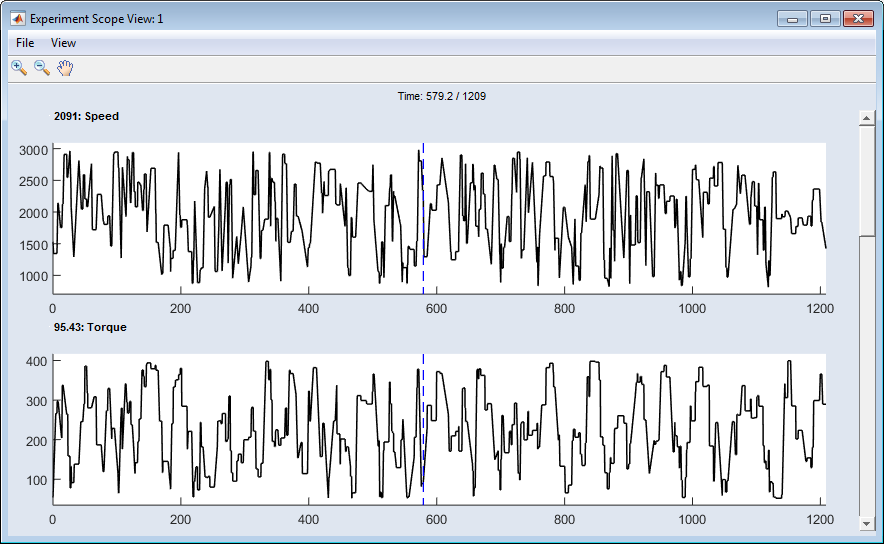
This scope plot window contains the same elements as described in "Scope View" Window.
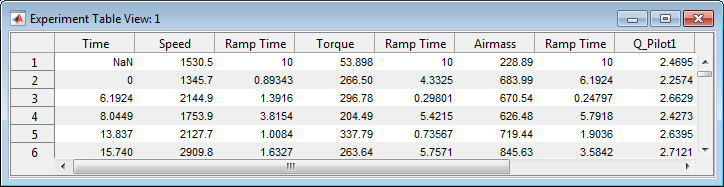
Table View
In this window, the points of the experiment plan are displayed as a table.
Update
This refreshes the display of the plots after changes have been made to the project.
Group Windows
Groups all currently opened windows so that they are all visible at the same time.
Group Child Windows
Closes all currently opened windows except for the main window.
Close Child Windows
Closes all currently opened windows except for the main window.