Step 4: Steady State Points
This step allows you to define operating points for the system, which have a frequency of stay in the experiment plan. In addition you can define steady state phases and the duration of the steady state phases.
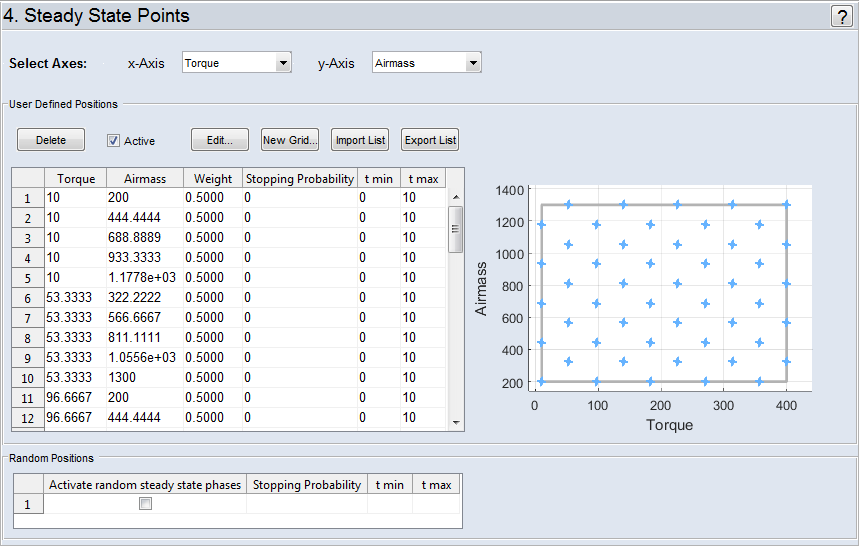
"Select Axes" Area
Here you can set the operating point axes. With them you can define the operating points, which have to be considered explicit in the experiment plan. The values of the operating point axes can be specified here and the remaining inputs will be varied according to the experiment plan.
"User Defined Positions" Area
|
Note |
|---|
|
For activating the area "User Defined Positions" you have to define inputs (Select Axes). |
Delete the Grid Points
By clicking on Delete, the selected cells of the table is deleted.
Activate/deactivate Grid Points
By activating Active, the defined steady state points in the table are considered in the experiment.
Edit Grid Points
In the table you can edit the points/cells in the columns ("<Input x>", "<Input y>", "Weight", "Stopping Probability", "t min", "t max").
|
Note |
|---|
|
You can only click on Edit if you have defined at least one steady state point. |
The meaning of the columns:
-
x values of the first operating points axis (Select Axes).
-
y values of the second operating points axis (Select Axes).
-
Weighting of the operating points, which determines the relative frequency to the corresponding operating point is hit in the experiment plan.
Note
Valid value: 0 ... 75. The higher the value is, the more is the frequency of stay. The total sum of the weights have to be in the interval [0 .. 75].
If you set the weight value "0", the corresponding point is not considered in the experiment plan. The color of the point changes to gray (
 ).
). -
In this column, you can set a probability (in percent) that a steady-state phase is integrated in the experiment plan if the operating point is hit.
-
In these columns, you set the minimal and maximal duration (in seconds) for the steady-state phase. If a steady-state phase is inserted, its duration is taken from the specified interval.
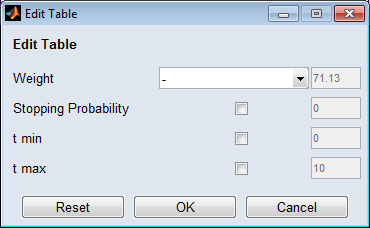
If you click on Edit, the  "Edit Table" window opens, which offers more editing options.
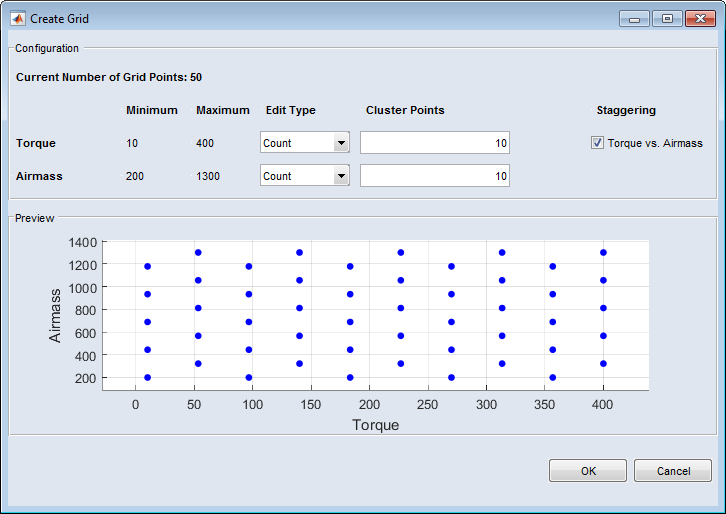
Editing current cluster points
If you click on New Grid, the "Create Grid" window opens, where you can redefine the steady-state points grid.
Import List
With Import List, you can load a list of steady-state points from an Excel file (*.xls, *.xlsx) or from a Comma Separated Values file(*.csv).
Export List
With Export List, you can export the list to an Excel file (*.xls, *.xlsx) or a Comma Separated Values file(*.csv).
"Random Positions" Area
By activating Activate random steady state phases, you can integrate steady state phases in the experiment plan on any point that was hit. The probability to stop at a hit point has to be defined in the "Stopping Probability" field.
In the "t min" and "t max" fields, you have to set the minimal and maximal duration (in seconds) for the random steady-state phases. If a steady-state phase is inserted, its duration is taken from the specified interval.
See also the tutorial in the Help (Step 4: Steady State Points).