Visualizing the Experiment Plan
To be able to evaluate the plan data, you can display it either graphically or as a table at any time.
Visualizing the experiment plan
-
In the ASCMO-STATIC ExpeDes main window, select View > Scatter Plot to show 2-dimensional representations of the experiment plan.
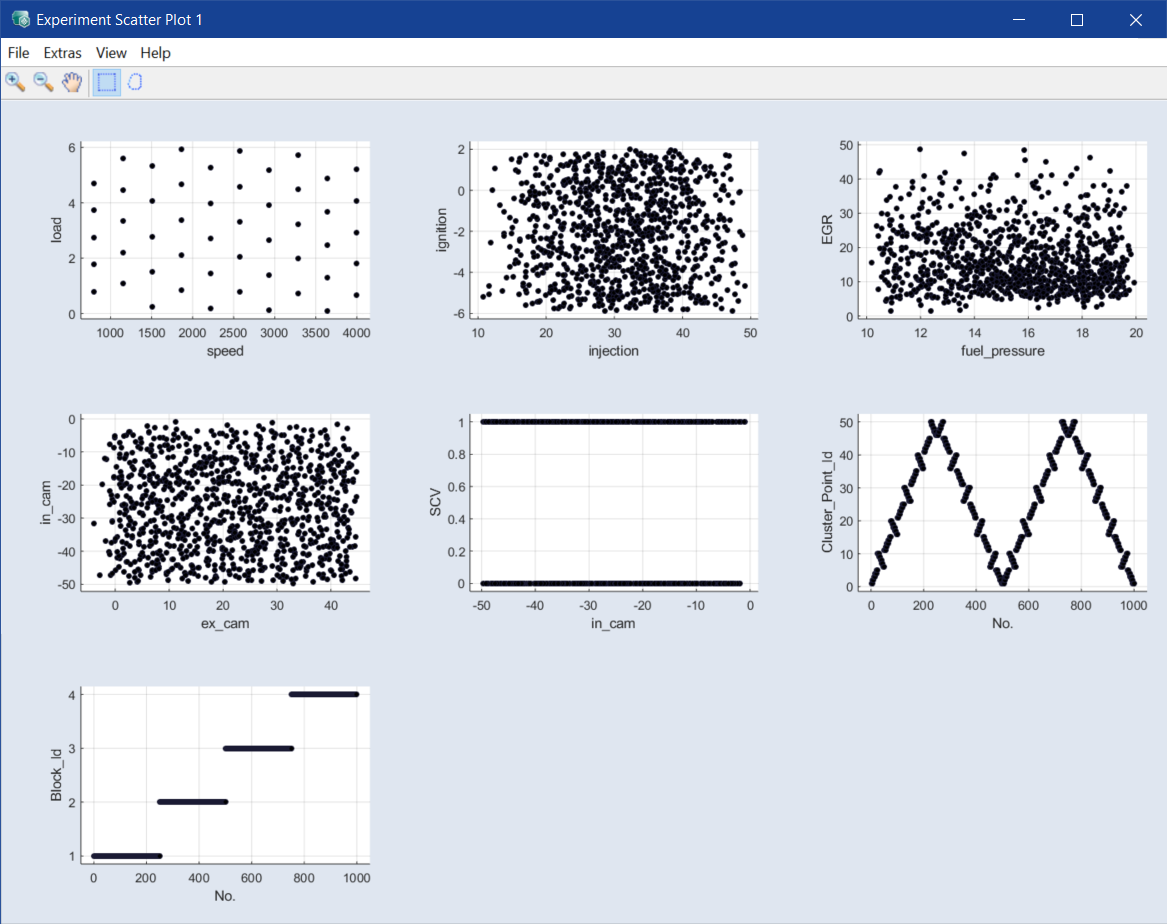
-
In the Experiment Scatter Plot window, use View > Select Axes to select the axes you want to show.
-
In the ASCMO-STATIC ExpeDes main window, select View > 3D View to show 3-dimensional plots.
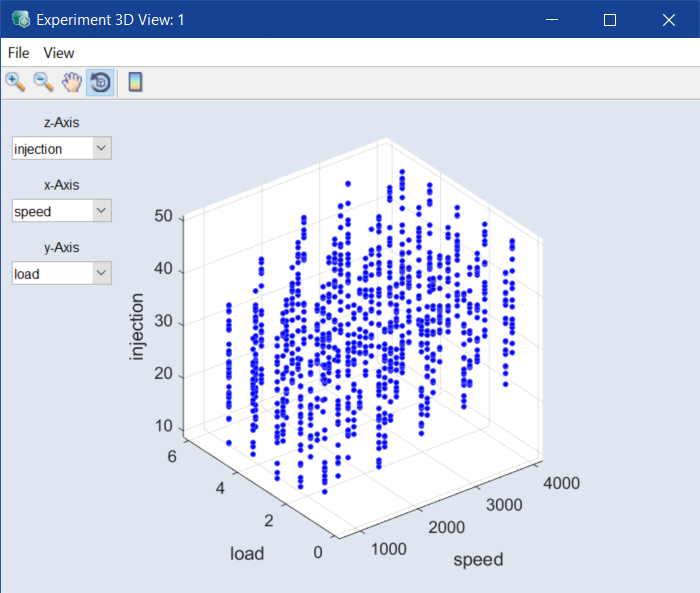
Here the axes you want to show are selected directly in the plot window.
-
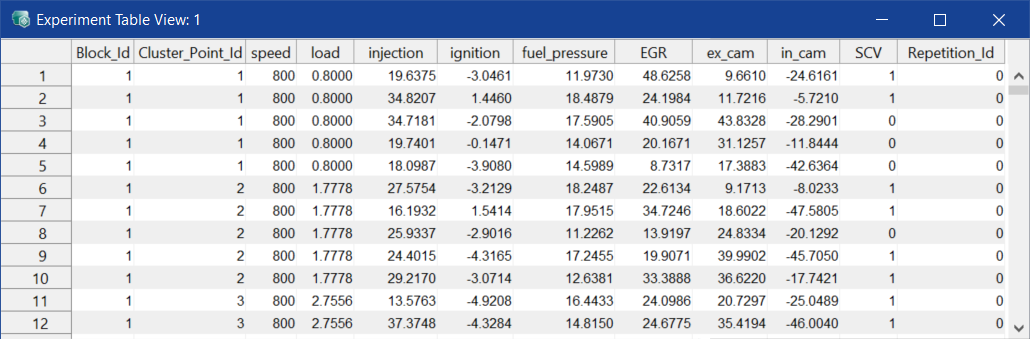
In the ASCMO-STATIC ExpeDes main window, select View > Table View to show the data of the measure plan in a table.