Step 3: Input Design Types
In this step, settings can be made to define how individual inputs are to be measured.
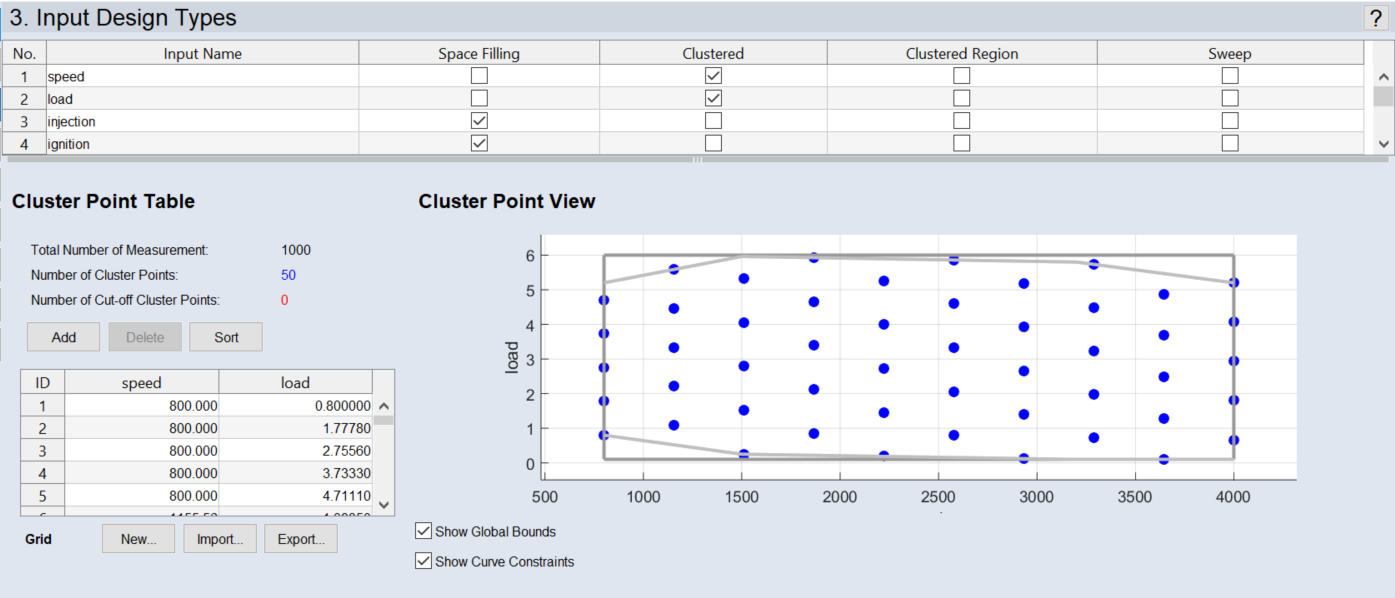
Fig. 16: ASCMO-STATIC ExpeDes Step 3: Input Design Types (type Clustered)
One of the following three measuring types can be selected for each input.
-
Space Filling: ASCMO-STATIC ExpeDes creates an experiment plan in which the measuring points are distributed space-filling and, at the same time, quasi-randomly.
-
Clustered: The concept of cluster points allows the user to disable the space-filling algorithm for certain parameters and, instead, concentrate the many measurements distributed in the space at a few locations (cluster).
This can be useful if the effort for setting an input is very high (e.g., operating point for engine measurement) or if certain parameters can be present only in form of discrete values (e.g., prototype parts for production).
If you configure a parameter as clustered, you are responsible for selecting the measuring points. ASCMO-STATIC ExpeDes provides support in specifying the points insofar as it offers an import of measuring points from files and the creation of an arrangement as a grid (see Cluster Point Table Area).
Note
The number of clustered inputs is limited to three.
-
Sweep: In the case of inputs of the type Sweep, specific points are addressed several times in every measurement.
If Input_n is defined as Sweep (consisting of m points), an experiment plan is created for Input_1 ... Input_n-1 and then extended so that the n-1 inputs are measured with the m values of Input_n each time.
If you configure an input as Sweep, you are responsible for selecting the measurement points. ASCMO-STATIC ExpeDes supports the user in defining the points by offering an import of measurement points from files and the generation of a grid arrangement (see This area shows a table for the input selected from the list with the property Sweep. Points can be selected, inserted, and deleted there. Simultaneously, the resulting measurement effort is indicated by the value "Total Number of Measurement".).
Note
Settings from the steps Constraints and Input Compression also have an effect on inputs of the type Sweep.
Cluster Point Table Area
This area displays the table of the current cluster points. Points can be selected, inserted, and deleted.
-
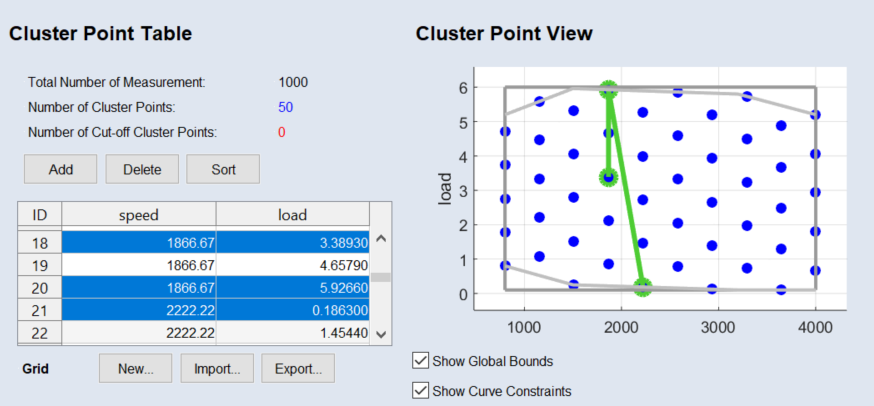
In the Cluster Point Table (left area below Input Design Types table), click in a row to select a point.
Multiselection is possible by pressing the <Shift> or <Ctrl> key.
Points selected in the table are displayed with green color to the right of the plot.
Inserting points
-
In the cluster point table, select the point after which you want to insert the new point.
If you do not select a point, the new point is inserted at the end of the list.
If you select several points, new points are added after each selected point.
-
Click Add.
-
The new point is inserted. If it is placed between two points, its values are determined according to the values in the rows above and below. If it is placed at the end of the list, its values are determined by the mean values of both axes.
Removing points
- In the cluster point table, select one or more points you want to delete.
-
Click Delete.
-
The points are deleted without warning.
Importing cluster points
If a cluster point grid exists as *.dcm or *.csv or *.xls file, it can be imported.
-
Below the cluster point table, click Import.
A file selection window opens.
-
Select the file you want to import and click Open.
The Import Grid window opens. Its content depends on the format of the import file. The Map Name drop-down list contains all maps in the file.
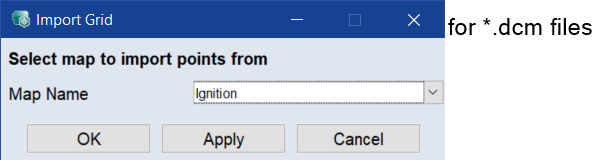
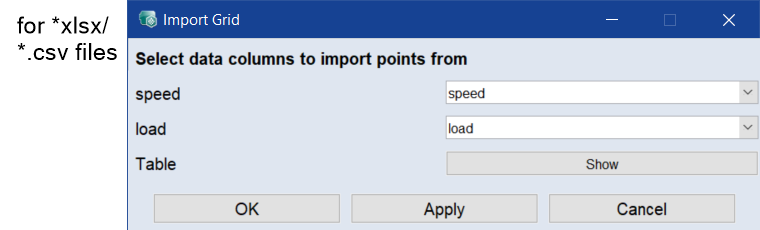
- Select the map you want to import.
-
Click OK.
-
If you selected a curve, an error message is issued and the import aborts.
If you selected a map, the map is imported and used as cluster point grid.
Note
The importer does not warn you if some or all axis values of the selected map are outside the range defined for the clustered inputs. Such axis values are cut off.
Editing cluster points
To change the number of cluster points, proceed as follows.
-
Below the cluster point table, click New.
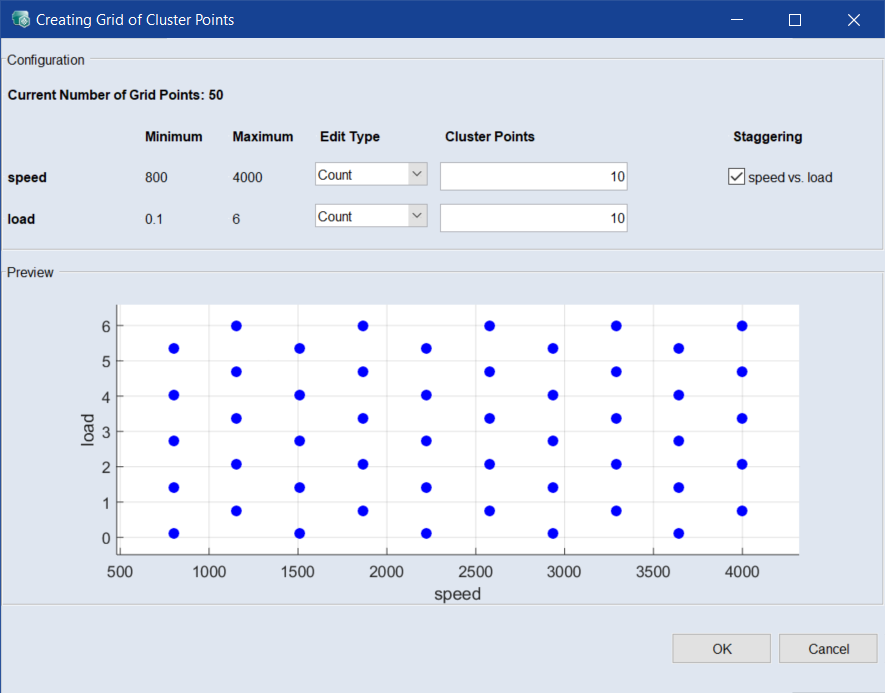
The Creating Grid of Cluster Points window opens.
-
To change the number of points on an axis, do the following:
-
In the drop-down list for the axis, select Count.
The number of points is displayed in the input field for the respective axis.
- Enter the desired number.
-
-
To enter the grid vector for an axis directly, do the following:
-
In the drop-down list for the constraint axis, select Vector.
The vector is displayed in the input field for the respective axis.
- Edit the vector values as desired.
Note
With type Count, the grid points are equidistant. With type Vector, you can distribute the grid points unevenly.
-
- Activate the option below Staggering to reduce the number of grid points and thus the variations of speed and load during measurement.
-
Click OK.
-
The points are adjusted accordingly. The Creating Grid of Cluster Points window closes.
Cluster Point View Area
The current values defined in the table are displayed here. Cluster points cut off by global bounds or constraints are shown as red dots. Cluster points selected in the table are highlighted by green circles (see also Selecting points).
Global bounds and constraints can be shown via the options below the plot.
Sweep Value Definition Area
This area shows a table for the input selected from the list with the property Sweep. Points can be selected, inserted, and deleted there. Simultaneously, the resulting measurement effort is indicated by the value "Total Number of Measurement".
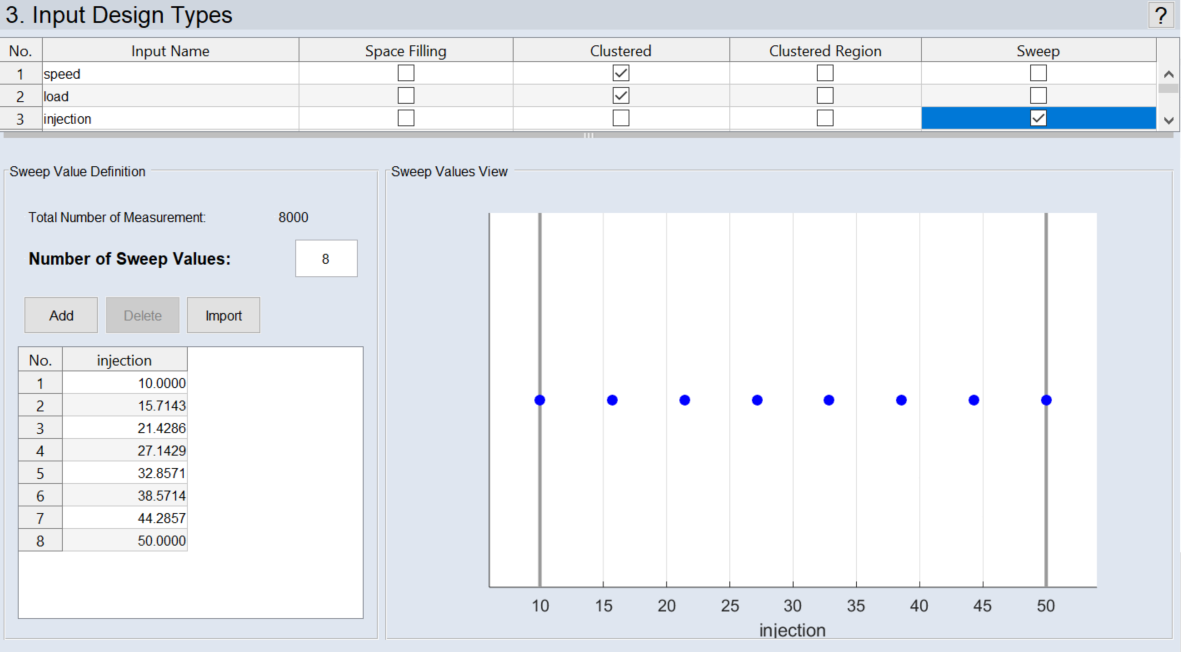
Fig. 17: ASCMO-STATIC ExpeDes Step 3: Input Design Types (type Sweep)
Selecting points
-
In the Sweep Value Definition area (left area below Input Design Types table), click in a row to select a point.
Multiselection is possible by pressing the <Shift> or <Ctrl> key.
-
Points selected in the table are displayed with green color to the right of the plot.
Inserting points
-
Increase the number in the Number of Sweep Values field and press <Return>.
If you entered n, n equidistant points are created.
Or
In the sweep value table, select the point after which you want to insert the new point.
If you do not select a point, the new point is inserted at the end of the list.
If you select several points, new points are added after each selected point.
-
Click Add.
-
The new point is inserted. If it is placed between two points, its value is determined according to the values in the rows above and below. If it is placed at the end of the list, it uses the maximum value.
Removing points
-
Decrease the number in the Number of Sweep Values field and press <Return>.
If you entered m, m equidistant points are created.
Or
In the sweep value table, select one or more points you want to delete.
-
Click Delete.
-
The points are deleted without warning.
Importing points
If a sweep value list exists as *.csv or *.xls or *.xlsx file, it can be imported.
-
In the sweep value table, click Import.
A file selection window opens.
-
Select the file you want to import and click Open.
The Import Grid window opens. The Map Name drop-down list contains all maps in the file.
- Select the list you want to import.
-
Click OK.
-
The list is imported. If one or more values in the list are outside the allowed range for the input, a warning is issued in the log window:
At least one value is outside the defined Min/Max range of this input and will be discarded!