"User Defined Positions" Area
Area B (ASCMO-DYNAMIC ExpeDes Step 4: Steady State Points) shows steady state points in a table and a plot. You can add, import/export, edit, and delete steady state points.
Adding a steady state point manually
|
Note |
|---|
|
To activate the User Defined Positions area, you have to define input axes in the Select Axes area. |
-
In the New row, click in a cell.
The cell becomes an input field.
-
Enter the value for the column.
All columns must be edited for a valid steady state point.
Column
Meaning
Input names (defined as x-Axis and y-Axis)
Values of the steady state point (e.g. Speed, Torque).
Weight
Relative frequency of how often the steady state point is hit in the DoE.
The higher the value, the more often the point is hit.
Note
The sum of all weights must be ≤ 75.
Stopping Probability
Probability (in [0 .. 100]) that a steady state phase occurs when the point is hit.
0 means steady state phase never occurs
100 means steady state phase always occurst min, t max
[t min .. t max] is the time interval from which the stopping time is drawn.
The steady state point is shown in the plot on the right side of the User Defined Positions area.
Adding a grid of steady state points
|
Note |
|---|
|
Existing steady state points are deleted when you add a grid of steady state |
-
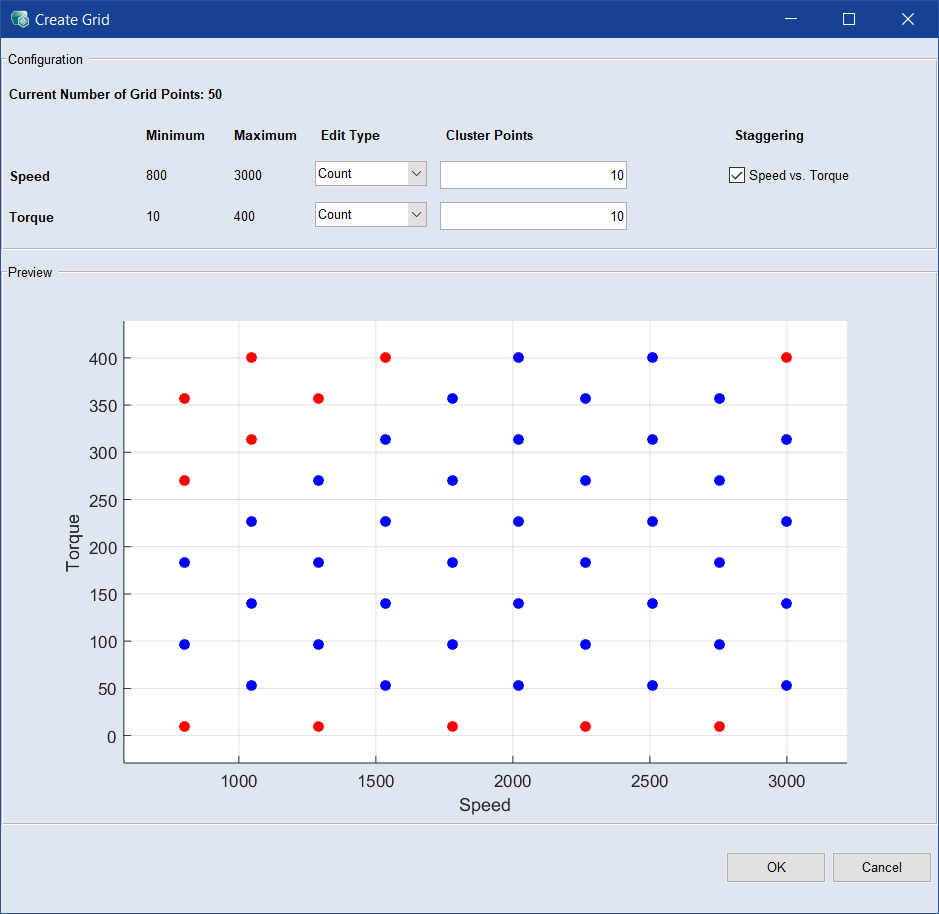
In the User Defined Positions area, click New Grid.
The Create Grid window opens.
-
To change the number of points on an axis, do the following:
-
In the drop-down list for the axis, select Count.
The number of points is displayed in the input field for the respective axis.
-
Enter the desired number.
-
-
To enter the grid vector for an axis directly, do the following:
-
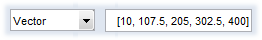
In the drop-down list for the constraint axis, select Vector.
The vector is displayed in the input field for the respective axis.
-
Edit the vector values as desired.
Note
With type Count, the grid points are equidistant. With type Vector, you can distribute the grid points unevenly.
-
-
Activate the option below Staggering to reduce the number of grid points.
-
Click OK.
The steady state points are added to the table and the plot. The Create Grid window closes.
Activating/deactivating steady state points
-
To activate all steady state points, activate the Active option.
Each steady state point is considered in the experiment plan, unless it is deactivated individually.
-
To deactivate a single steady state point, set its weight to 0.
-
To deactivate all steady state points, deactivate the Active option.
You can still add, edit, import/export, and delete steady state points, but they will not be considered in the experiment plan.
Editing a single steady state point
-
In the desired row, click in the cell you want to edit.
The cell becomes an input field.
-
Enter the desired value for the column.
Editing all steady state points
-
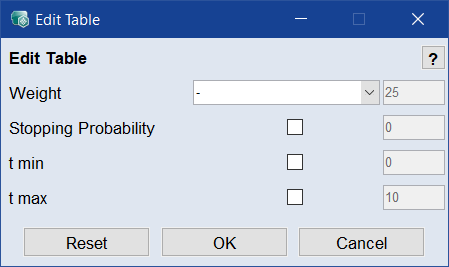
In the User Defined Positions area, click Edit.
The Edit Table window opens.
-
In the Weight drop-down list, select the way you want to change the weights.
Equally distribute weights with total quantity of ...: The weights of all n steady state points are set to the same fraction sum/n of the desired sum of all weights.
Renorm current weights to total quantity of ...: The weights of all steady state points are scaled so that the sum reaches the desired value. The ratio of the weights is kept.
-
In the input field, enter the sum of all weights.
-
In the Stopping Probability, t min and t max rows, do the following:
- Activate the checkbox if you want to apply the options.
- In the input field, enter the value you want to assign to all steady state points.
-
Click OK.
-
The steady state points are changed according to your settings.
- In the steady state point table, select the row(s) you want to delete.
-
Click Delete.
The steady state points are deleted without further notice.
If a steady state point grid exists as *.csv or *.xls / *.xlsx / *.xlsm file, it can be imported.
-
In the User Defined Positions area, click Import List.
A file selection window opens.
-
Select the file you want to import and click Open.
If you selected a file with several work sheets, the Select Sheet window opens.
-
Select the desired work sheet and click OK.
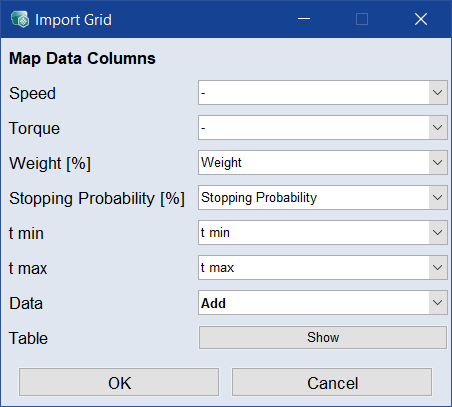
The Import Grid window opens. The drop-down lists contain the column names found in the import file.
-
In the Import Grid window, map the columns of the steady state point table to appropriate columns of the import file.
-
In the Data drop-down list, select the import mode (Add or Replace).
-
Click OK to start the input.
You can export the entire list of steady state points. Exporting only parts of the list is not possible. Available export formats are e.g. *.csv, *.xls and *.xlsx.
-
In the User Defined Positions area, click Export List
A file selection window opens.
-
Select the file type.
-
Specify the location and the file name and click Save.