Example of an Applied Input Compression
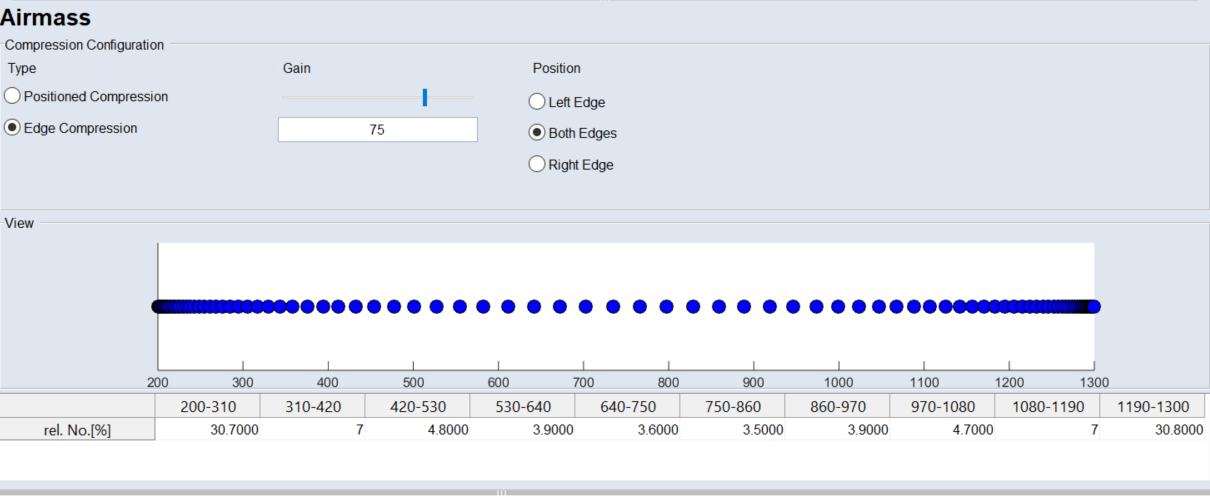
In the figure below, the measurements of Airmass (with no constraint) are compressed using Edge Compression with a gain of 75 to both edges of the measurement range.
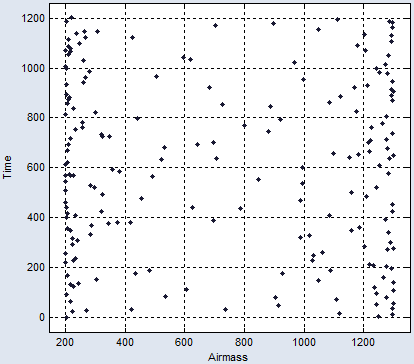
If you visualize the applied compression in a scatter plot (View > Scatter Plot), you can see that the space-filling values of the experimental plan are now compressed in the direction of the edges.