Anomaly Detection Scope View
Model menu > Anomaly Detection Scope View
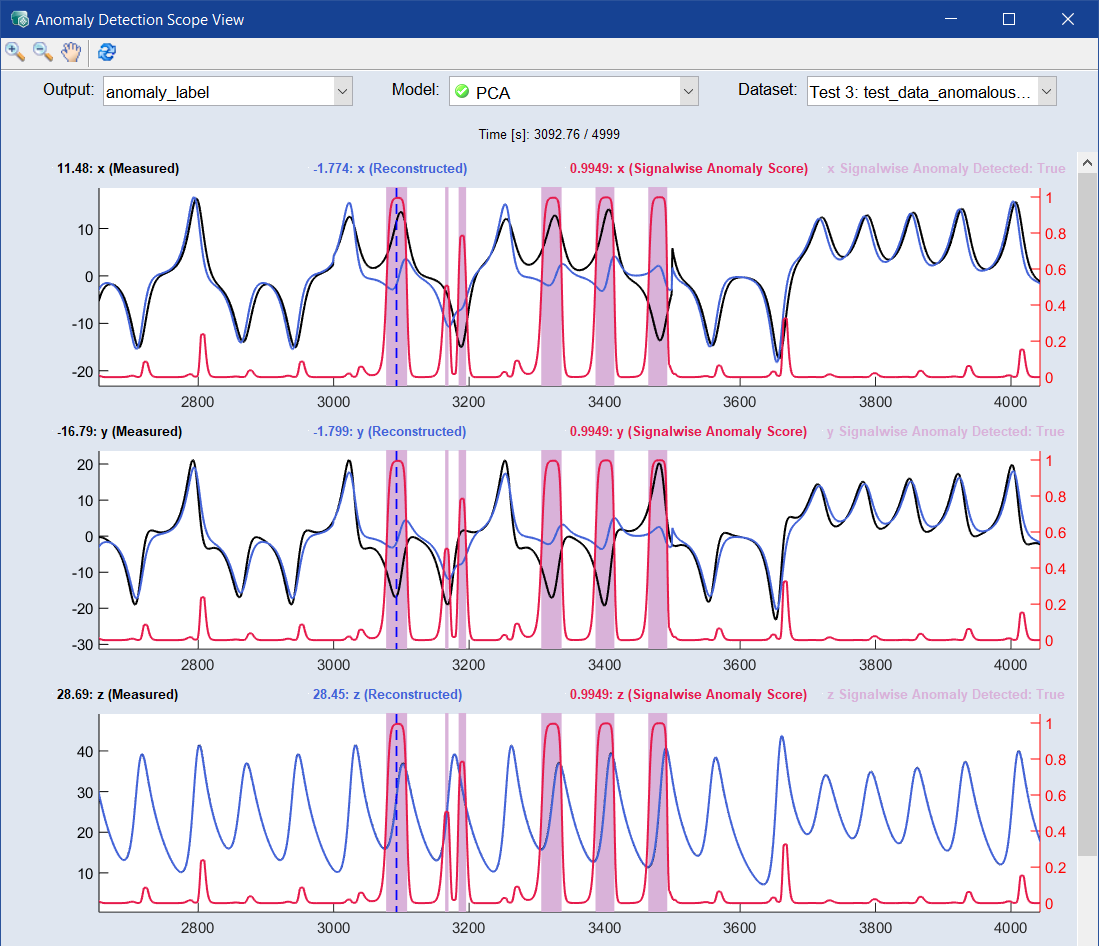
The Anomaly Detection Scope View window contains the following elements:
 Toolbar


With the drop-downs you can select the output, model and dataset to be displayed.
Each input signal is displayed in a separate plot. The last plot shows the output and the total anomaly score.
Click anywhere in a plot to place the x-axis cursor (dashed blue line) for all plots. The exact y value of each line is displayed above the corresponding plot.
Measured: The black line represents the measured data.
Reconstructed: The blue line represents the reconstructed data
The difference between measured and reconstructed data indicates anomalies.
Signalwise Anomaly Score: The red line represents the anomaly score per signal.
Signalwise Anomaly Detection: The pink bars indicate anomalies.
The threshold for anomalies can be set in the Model Configuration window under Rounding Threshold (Model > Configurations). The default value is 0.5. The smoothing window blurs the boundaries slightly.
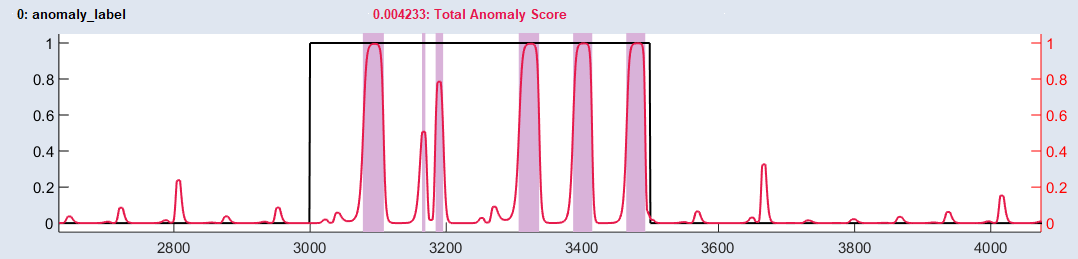
Last plot:
The black line represents the selected output.
Total Anomaly Score: The red line of the last plot indicates the total anomaly score of all signals.