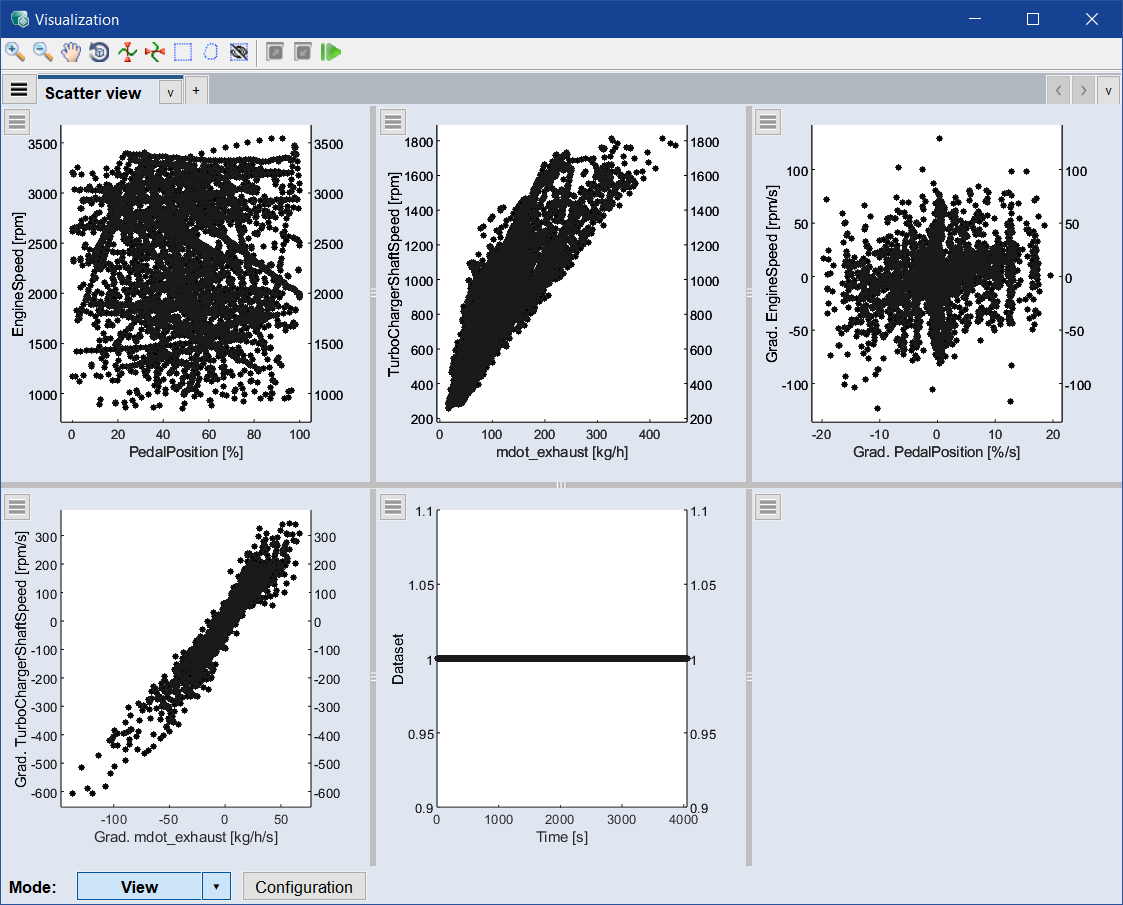
Scatter Plots
The scatter plots (shown via Data > Scatter Plot > Training Data) show the coverage of the training data in the possible input and output range. By marking a block in the Data Set vs. Time plot, the corresponding input and output values at these time steps of the time series can be visualized.
The scatter plots will be useful later during model validation (see section Model Validation) to check whether the data is in the range of the input data. This is crucial since ASCMO-DYNAMIC uses a data-driven modeling algorithm, which cannot guarantee a reliable extrapolation into areas not covered.
The content of the scatter plots can be changed with Configuration > X-Axis / Y-Axes in the scatter plot windows.