Model Validation with Scatter Plot
You can use the functions Data > Scatter Plot > All Data and View > Select Axes to check the distribution of the test data and its gradients.
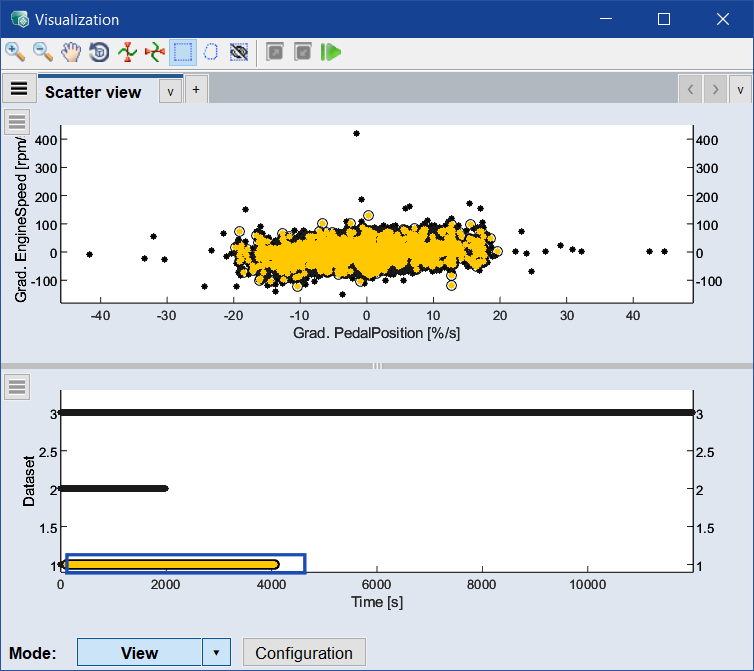
To avoid extrapolation, the test data (black in the above screenshot) is expected to be within the range of the training data (yellow in the above screenshot), which is the case in the diesel engine example.