Model Improvement Through Recognition and Deletion of Outliers
Measuring points whose model errors (i.e. the deviation of the measured value from the model prediction) are high are referred to as outliers.
Besides the visual evaluation in the corresponding plots, the term can also be interpreted quantitatively: An outlier exists if the residual is > 3-4 x RMSE.
The visual assessment can take place in "Measured vs. Predicted" displays (such as in the plots opened with Model → Error (* ) → Measured vs. Predicted).
The following figure shows the measuring data of the fuel consumption of an engine over the model prediction. The marked points have been identified as outliers by ASCMO-STATIC.
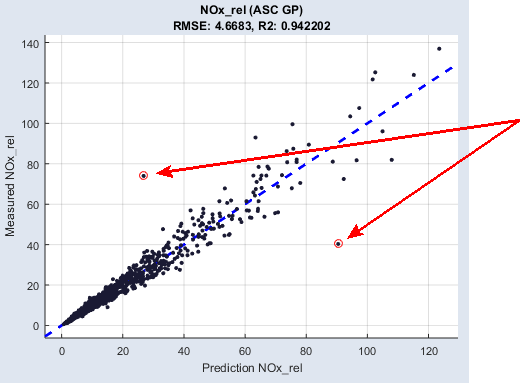
The reasons for the occurrence of such deviations can be simple errors in the measurement (e.g. due to defective measuring equipment). Another possibility is that the measurement took place in the limit range of the engine and, hence, could not be mapped by the model.
It can easily be seen that such measuring points have a negative effect on the model. While the green graph in the next figure results from the modeling based on the blue points, the model training including the red outlier results in a graph (red) that features significant deviations to the measured data.