Interactions <output>
Model menu > Interactions ><output>
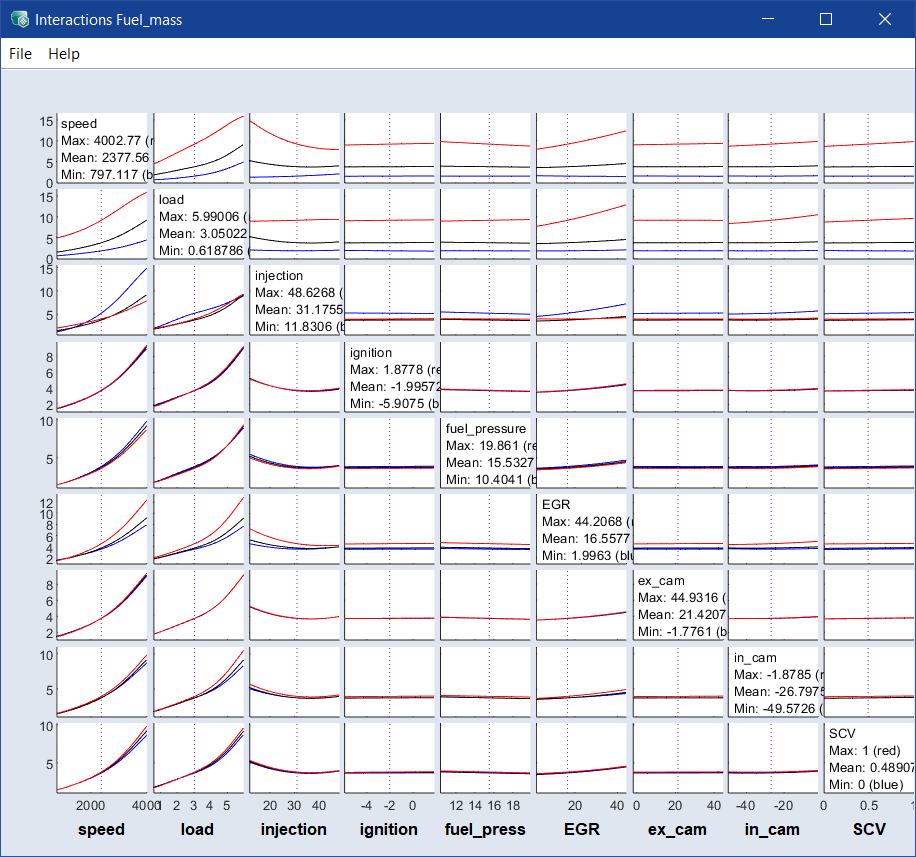
The degree of interaction of two inputs on the respective output is graphically displayed in this window.
In every individual diagram, an input variable (the column) is continuously being varied, a second input variable (the row) features three discrete values Min, Mean and Max, which results in three graphs per diagram.
A significant interaction between two inputs each is present if the graphs in a diagram do not run parallel or even intersect.
Example
In Diagram 1, the variable ex_cam continuously varies, while ignition is represented with three different values (-6.2, -2.03656 and 2.3). Since all three graphs run parallel to each other, it follows that only a minor interaction is present between both inputs.
A different scenario in Diagram 2: Here, the continuous variation of injection at three different values of load leads to cross-overs so that a significant interaction between both inputs can be assumed in this case.
 File
File|
Note |
|---|
|
The values of the inputs are displayed by the dashed blue line and can be set here just like in the ISP view. |