ASCMO-STATIC | ASCMO-DYNAMIC >
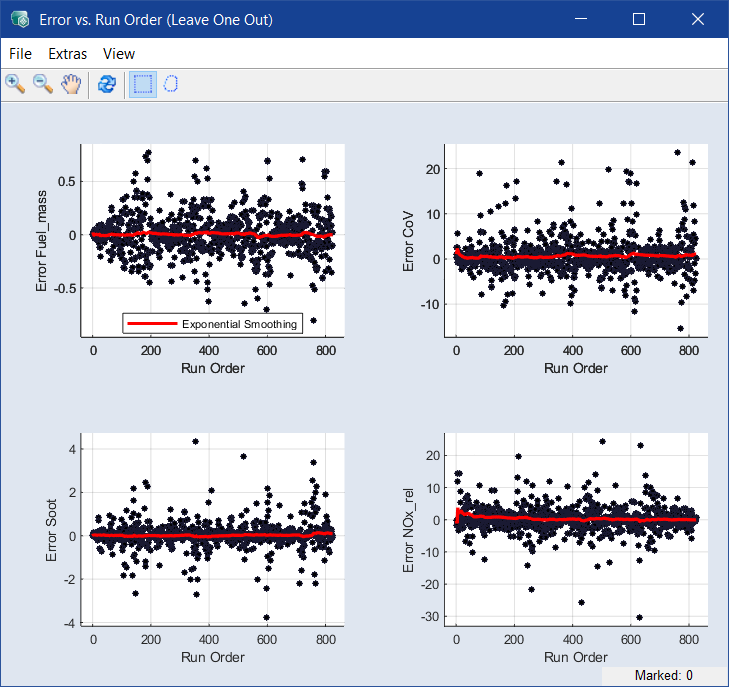
Error vs. Run Order
Model menu > Error (Leave-One-Out)> Error vs. Run Order
|
The description of this window refers to the error that is based on the Leave-One-Out method – but it applies analogously to the errors based on training or test data.
|
The Error vs. Run Order window plots the error of the calculated outputs (referenced to the measured values) against the running number of the measurement.
With the procedure of exponential smoothing, marked by red lines in the plots, trends in the development of the error over the entire measurement duration can be detected.
The functions of the menus and the context menu of the individual plots are described in Scatter Plot .
 File
File
-
New
|
Unavailable in some scatter plot windows.
|
Opens the Select Axes window where you can select axes pairs to be plotted in an additional window.
-
Export All Data
Exports all data points into an Excel (*.xls, *.xlsx), CSV (*.csv), MDF3 (*.dat) or MDF4 (*.mf4) file.
-
Export Intersection of Selected Data
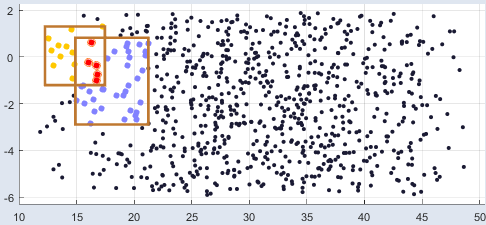
Exports the data points in the overlap area of all rectangles into an Excel (*.xls, *.xlsx), CSV (*.csv), MDF3 (*.dat) or MDF4 (*.mf4) file. These data points appear as red dots in the scatter plot.
If there is no area where all rectangles overlap, or if the overlap area of all rectangles is empty, there are no data points that can be exported.
-
Export Union of Selected Data
Exports the data points in all rectangles, i.e. all colored dots in the scatter plot, into an Excel (*.xls, *.xlsx), CSV (*.csv), MDF3 (*.dat) or MDF4 (*.mf4) file.
This export function works for overlapping and non-overlapping rectangles.
-
Close
Closes the window.
Extras
-
Remove All Rectangles/Lassos
Rectangles drawn over a single plot with the left mouse button pressed are removed again.
-
Delete Marked Points and Retrain
Deletes all points marked in any of the plots, saves the dataset and starts a new model training.
-
Unmark All
All marked points are unmarked.
-
Relative Error vs. Run Order
Opens another scatter plot window that shows the relative error vs. run order.
-
Studentized Error vs. Run Order
Opens another scatter plot window that shows the studentized error vs. run order.
-
Runs Test (Test Independence)
It's the "Wald-Wolfowitz runs test"
-
Autocorrelation (Test Periodicity)
Shows the Autocorrelation of the Output residuals.
View
-
Plot Settings
Opens the Edit Axes window where you can set the minimal size of the plots in pixel. If you change the size and click OK or Apply, each scatter plot smaller than the new values is adapted automatically.
|
The information in the Edit Axes window will be saved in ASCMO-STATIC and used in all scatter plots.
|
-
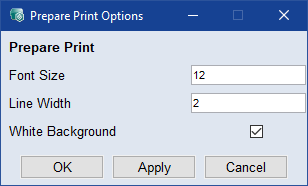
Prepare Print
Opens the Prepare Print Options window where you can adjust the look of the plot area. The settings are reset when you close the plot window.
-
Save as Bitmap
This allows the content of the window to be saved in a series of graphic formats.
-
Copy to Clipboard
Copies the window content to the clipboard.
-
Update
Updates the plots in the window.
Toolbar
For a description of the context menus in the plot, see Scatter Plot Windows - context menus.