Measured vs. Predicted (<method>)
Model menu > Error (<method> = Leave One Out or Test Data or Training Data) > Measured vs. Predicted
|
Note |
|---|
|
The description of this window refers to the error that is based on the Leave-One-Out method, but it applies analogously to the errors based on training or test data. |
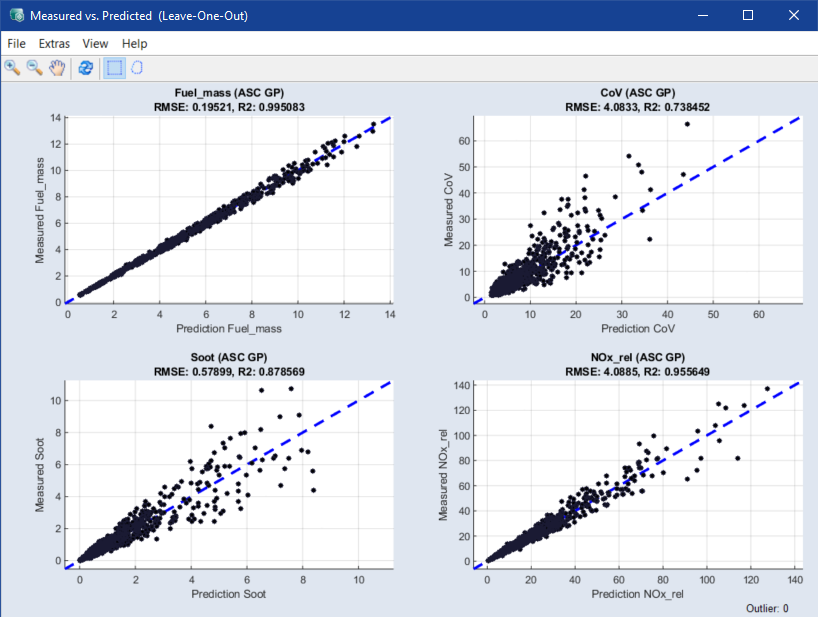
In each plot, the model output is displayed on the X-axis and the measuring points are displayed on the Y-axis. A perfect match between the two would result in a "pearl necklace" (y = x) on the line drawn in blue. The further the points are removed from the blue line, the greater the difference between measurement and model output. This allows visually determining the model quality.
It also allows recognizing outliers, i.e. points that are located far away from the blue line. Possible reasons for their occurrence can be measurement errors or even a still insufficient model quality.
In the header of each graphic, the model type as well as the RMSE and the R2 value are displayed. These are two standard variables for assessing the quality of models (see the ASCMO-STATIC Help).
The Measured vs. Predicted (<method>) window contains the following elements:
-
New
Note
Unavailable in some scatter plot windows.
Opens the Select Axes window where you can select axes pairs to be plotted in an additional window.
-
Export All Data
Exports all data points into an Excel (*.xls, *.xlsx), CSV (*.csv), MDF3 (*.dat) or MDF4 (*.mf4) file.
-
Export Intersection of Selected Data
Exports the data points in the overlap area of all rectangles into an Excel (*.xls, *.xlsx), CSV (*.csv), MDF3 (*.dat) or MDF4 (*.mf4) file. These data points appear as
red dots in the scatter plot. 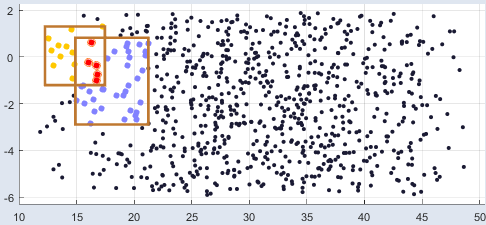
If there is no area where all rectangles overlap, or if the overlap area of all rectangles is empty, there are no data points that can be exported.
-
Export Union of Selected Data
Exports the data points in all rectangles, i.e.
all colored dots in the scatter plot, into an Excel (*.xls, *.xlsx), CSV (*.csv), MDF3 (*.dat) or MDF4 (*.mf4) file. This export function works for overlapping and non-overlapping rectangles.
-
Close
Closes the window.
-
Remove All Rectangles/Lassos
All rectangles or lassos in the scatter plots are removed again.
-
Detect Outlier
Identifies all outliers determined according to the defined criteria and marks them with a red circle.
-
Unmark All
All marked points are unmarked.
-
Note
Only available if the Advanced Settings are enabled.
Shows
a slider and an editing field in the plot window.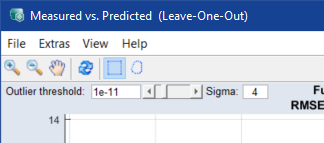
Points that meet both of the following conditions are identified as outliers:
-
Outlier Threshold
The adjustable value ranges from 10-14 to 1 (level of significance).
-
Sigma
Value of standard deviation
-
-
Delete Marked Points and Retrain
Deletes all points marked in any of the plots, saves the dataset and starts a new model training.
-
Show Inputs
Opens the Inputs for Measured vs. Predicted (<method>) window.
-
Plot Settings
Opens the Edit Axes window where you can set the minimal size of the plots in pixel. If you change the size and click OK or Apply, each scatter plot smaller than the new values is adapted automatically.
Note
The information in the Edit Axes window will be saved in ASCMO-STATIC and used in all scatter plots.
-
Prepare Print
Opens the
Prepare Print Options window where you can adjust the look of the plot area. The settings are reset when you close the plot window.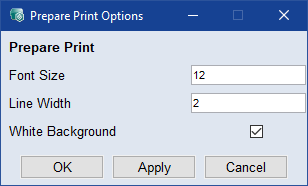
-
Save as Bitmap
This allows the content of the window to be saved in a series of graphic formats.
-
Copy to Clipboard
Copies the window content to the clipboard.
-
Update
Updates the plots in the window.
-
User Guide: Opens the PDF User Guide.
-
Online Help: Opens the online help (F1).
-
Interface Help: Opens the interface help.
-
License: Opens the ETAS License Manager.
-
Support: Displays contact information for various ETAS support channels.
-
Safety Advice: Opens the ETAS safety advice.
-
About: Opens the About window, where you can also get information about OSS used in ASCMO.
This table shows a selection of possible toolbar buttons.
|
|
Zoom in |
By clicking in the plot, the visualization becomes larger. |
|
|
Zoom out |
By clicking in the plot, the visualization becomes smaller. |
|
|
Pan |
This allows you to move the plot within the window. |
|
|
Mouse selection in plot with rectangle |
Sets the selection tool in the scatter plots to a rectangle. |
|
|
Mouse selection in plot with lasso |
Sets the selection tool in the scatter plots to a lasso. |
|
|
Update |
Updates the plots in the window. |


-
empty place in a plot
-
Create Rectangle
Opens the Create Rectangle window where you can enter start and end points for the axes of a new rectangle.
-
Select Axes Manually
Opens the Select Axes Manually window where you can edit the X and Y ranges of the plot.
-
-
a point
Note
The context menu of a point contains a subset of the context menu options listed here.
-
Index: <n> | Value: [<x> <y>]
Shows the index number and the values of the selected point.
-
Show Result
Opens the Current Point window that displays the values for the selected point.
-
Show Result in Other Views
Marks the selected point in the other plots of the window.
-
Apply Result to Calibration Maps
Writes the result to the calibration maps.
-
Mark (All Outputs area) or Mark *
= e..g., as Outlier in All OutputsThe data point is marked for deletion in all outputs.
-
Unmark in All Outputs
The marked data point is unmarked in all outputs.
-
Mark (<output> area) or Mark *
= e..g., as Outlier in Selected OutputThe data point is marked for deletion in the selected output.
-
Unmark in Selected Output
The marked data point is unmarked in the selected output.
-
Show Point in Intersection Plot
The data point selected in the plot is displayed in the ISP view.
-
-
a rectangle or lasso
Note
The context menu of a rectangle or lasso contains a subset of the context menu options listed here.
-
Remove Rectangle or Remove Lasso
Removes the respective rectangle or lasso. Marked points remain marked.
-
Set Position
Opens the Create Rectangle window where you can enter start and end points for the axes of the rectangle.
-
Mark (All Outputs area) or Mark *
= e..g., as Outlier in All OutputsData points within the rectangle are marked for deletion in all outputs.
-
Unmark (All Outputs area) or Unmark in All Outputs
Marked data points within the rectangle are unmarked in all outputs.
-
Mark Outside (All Outputs area)
Data points outside the rectangle are marked for deletion in all outputs.
-
Unmark Outside (All Outputs area)
Marked data points outside the rectangle are unmarked.
-
Mark *
= e..g., as Outlier in Selected Output
Data points within the rectangle are marked for deletion in the selected output.
-
Unmark in Selected Output
Data points within the rectangle are unmarked in the selected output.
-
R^2 and RMSE of Selected Points (All Outputs area)
Calculates RMSE and R2 errors for the selected points for all outputs.
-