Valid Model Range Scatter Plot for <output>
Model menu > Scatter Plot Valid Model Range > <output name>
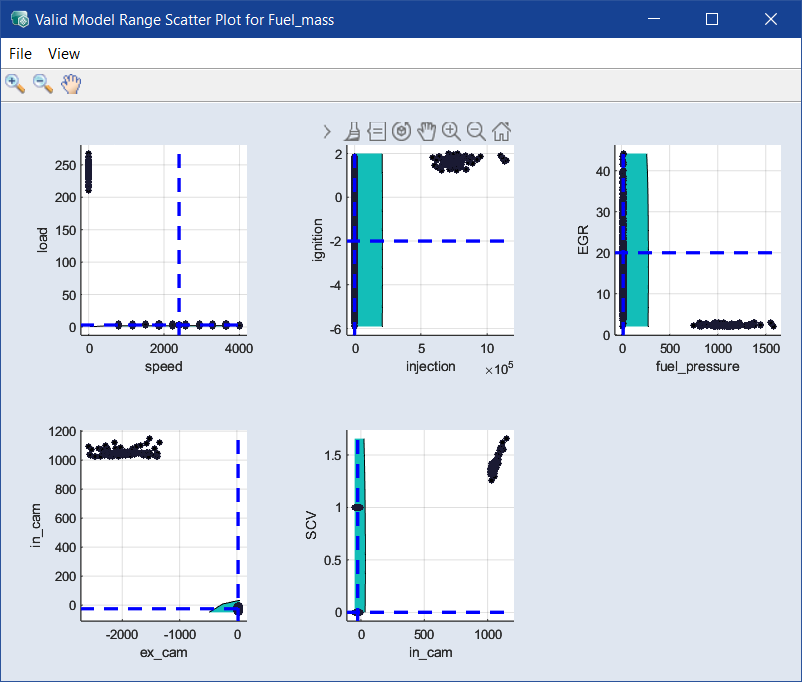
The Valid Model Range Scatter Plot for <output> window shows, for the selected model (= output), the range in which the model is valid in the 2D scatter plots of the inputs.
-
Export All Data
Exports all data points into an Excel (*.xls, *.xlsx), CSV (*.csv), MDF3 (*.dat) or MDF4 (*.mf4) file.
-
Close
Closes the window.
-
Plot Settings
Opens the Edit Axes window where you can set the minimal size of the plots in pixel. If you change the size and click OK or Apply, each scatter plot smaller than the new values is adapted automatically.
Note
The information in the Edit Axes window will be saved in ASCMO-STATIC and used in all scatter plots.
-
Prepare Print
Opens the
 Prepare Print Options window where you can adjust the look of the plot area. The settings are reset when you close the plot window.
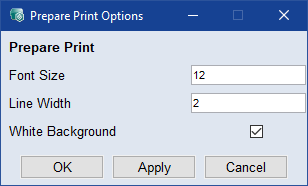
-
Save as Bitmap
This allows the content of the window to be saved in a series of graphic formats.
-
Copy to Clipboard
Copies the window content to the clipboard.
-
Update
Updates the plots in the window.
-
empty place in a plot
-
Set Axes Limits
Opens the Set Axes Limits window where you can edit the X and Y ranges of the plot.
-
-
a point
-
Index: <n> | Value: [<x> <y>]
Shows the index number and the values of the selected point.
-
Choose Value
Marks the selected point in all scatter plots with two crossed lines.
-
This table shows a selection of possible toolbar buttons.
|
|
Zoom in |
By clicking in the plot, the visualization becomes larger. |
|
|
Zoom out |
By clicking in the plot, the visualization becomes smaller. |
|
|
Pan |
This allows you to move the plot within the window. |
|
|
Mouse selection in plot with rectangle |
Sets the selection tool in the scatter plots to a rectangle. |
|
|
Mouse selection in plot with lasso |
Sets the selection tool in the scatter plots to a lasso. |
|
|
Update |
Updates the plots in the window. |


