Training \ Test \ All Data
These windows are opened with the Data > Scatter Plot > Training \ Test \ All Data
The data are displayed as scatter plots in a Training \ Test \ All Data window and can also be edited there.
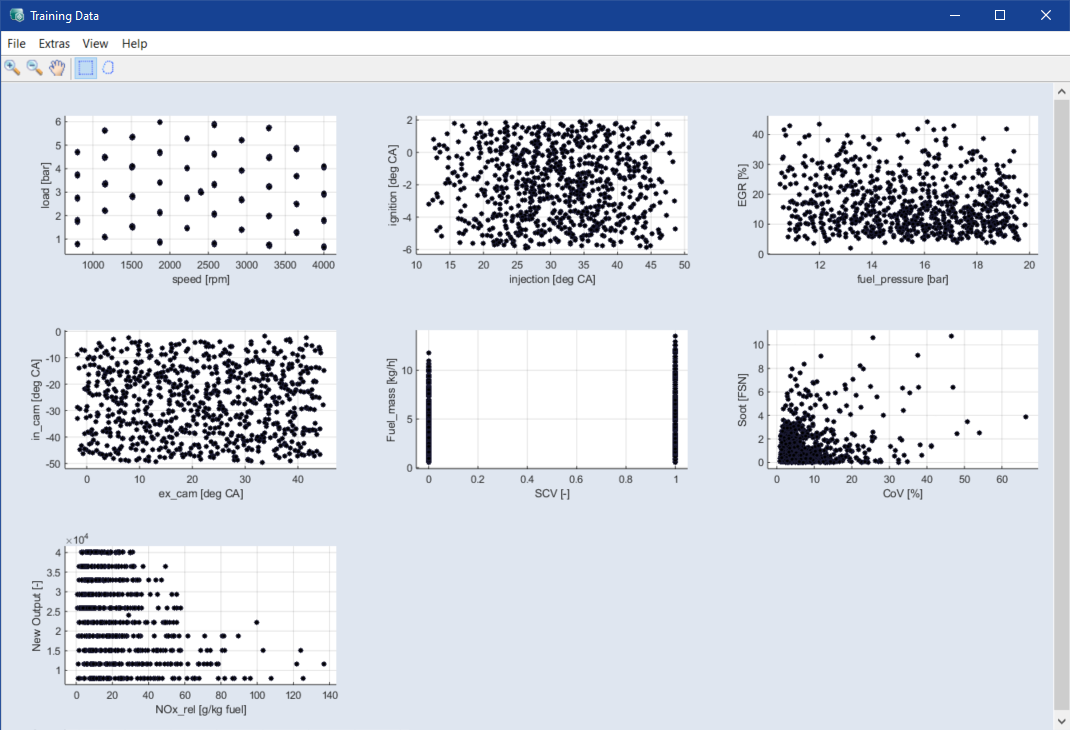
This allows a graphical control of the measuring data. The following points should be given special attention:
- Clean even distribution of the measuring data for all inputs
- Correctly measured areas
- Plausible measured values of output variables
|
Note |
|---|
|
The functions for editing the displayed data can be called via the menus and via the context menu in the respective plot. (see The menus of the "Input and Output Training Data" window). |
If you selected Data > Scatter Plot > All Data, test data and training data are shown in the same scatter plots. A plot represents the training and test data. You can easily select the data points of the training/test data set so that they are highlighted in all plots.
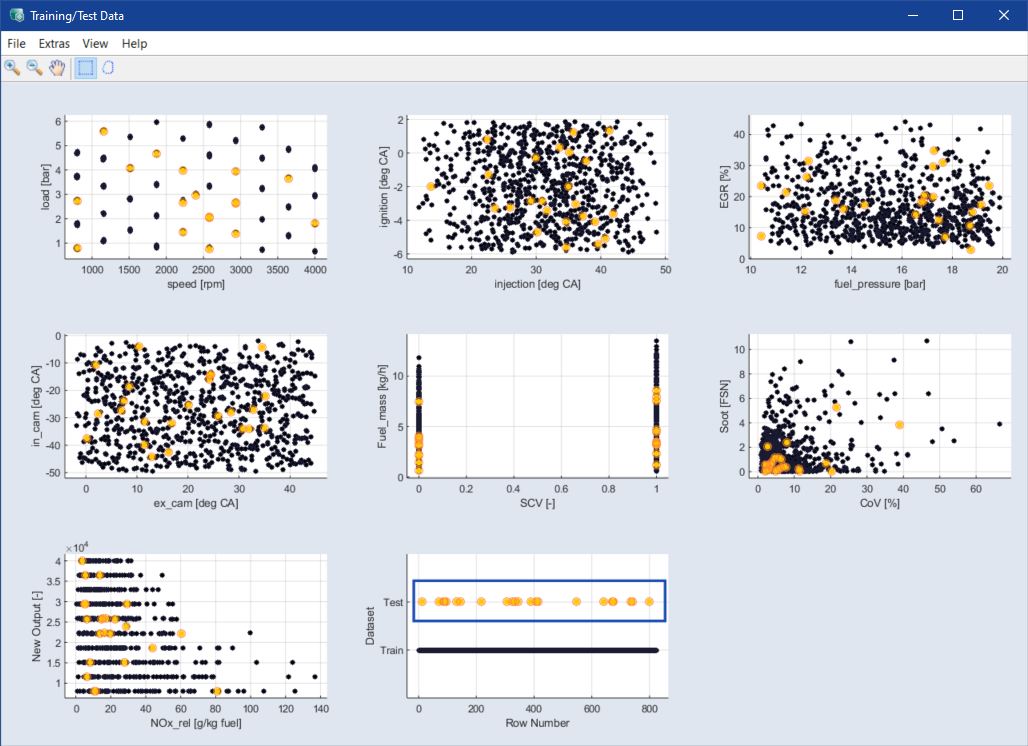
The functions of the menus and the context menu of the individual plots are described in Scatter Plot .