Model Improvement Through Recognition and Deletion of Outliers
Measuring points whose model errors (i.e. the deviation of the measured value from the model prediction) are high are referred to as outliers.
Besides the visual evaluation in the corresponding plots (see Fig. 8), the term can also be interpreted quantitatively: An outlier exists if the residual is > 3-4 x RMSE.
The visual assessment can take place in Measured vs. Predicted displays (such as in the plots opened with Model > Error (<method>) > Measured vs. Predicted, <method> = Leave-One-Out, Test Data or Training Data).
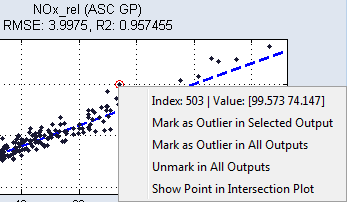
The following figure shows the measured data of an engine over the model prediction. The marked points have been identified as outliers by ASCMO-STATIC.
![]()
Fig. 8: Outliers in the Measured vs. Predicted display
The reasons for the occurrence of such deviations can be simple errors in the measurement (e.g. due to defective measuring equipment). Another possibility is that the measurement took place in the limit range of the engine, and hence could not be mapped by the model.
It can easily be seen that such measuring points have a negative effect on the model. While the green graph in Fig. 9 results from the modeling based on the blue points, the model training including the red outlier results in a graph (red) that features significant deviations to the measured data.
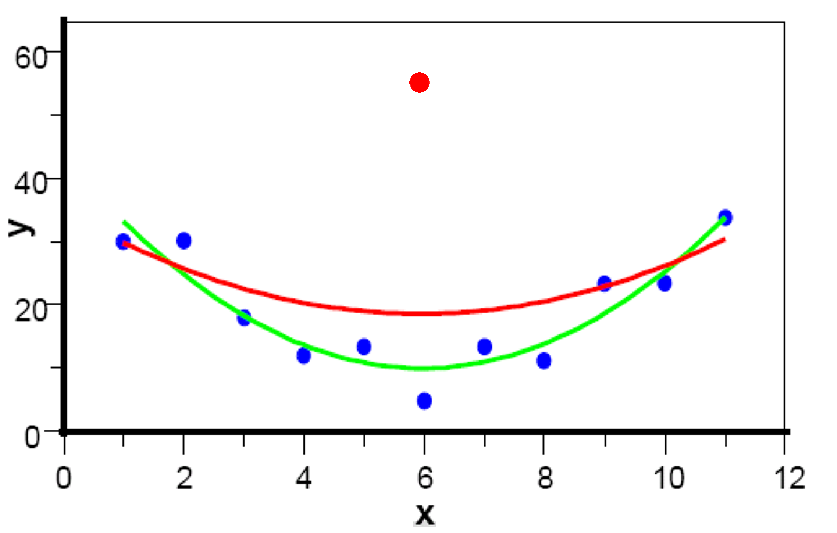
Fig. 9: Modeling with (red) and without (green) outlier
The following section contains instructions about how to recognize and remove outliers.
-
Select Model > Error (Leave-One-Out) > Measured vs. Predicted.
The measure values and the model prediction of the outputs are displayed.
-
Select Extras > Set Outlier Threshold.
The menu entry is only visible when the Advanced Settings are enabled. Enable these in the menu of the main window with File > Options, if necessary.
A slider (Outlier Threshold:) and an input field (Sigma) are displayed.
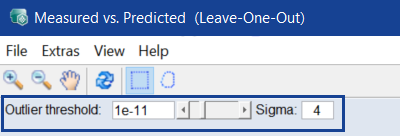
-
Leave Sigma at 4 and increase the significance level to higher values.
The higher the significance level, the larger the number of outliers (indicated by red circles).
The outlier becomes even clearer if you allow the absolute or relative error to be displayed, or display the data in a normal probability plot.
-
To do so, do one of the following:
- Select Model > Error (Leave-One-Out) > Error vs. Output
- Select Model > Error (Leave-One-Out) > Probability Plot
-
Depending on the menu option you selected, one of the following windows opens.
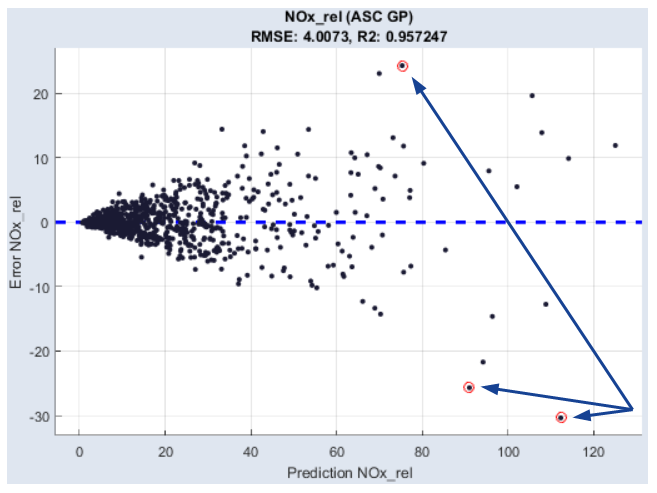
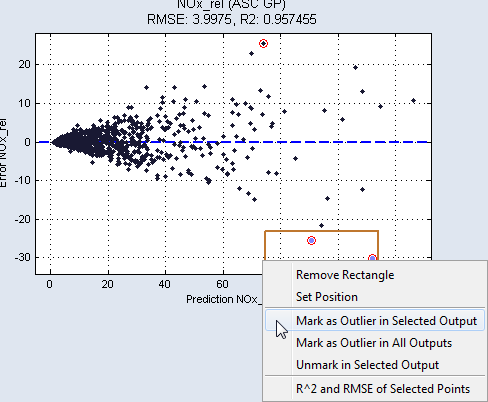
Fig. 10: Absolute error versus model prediction
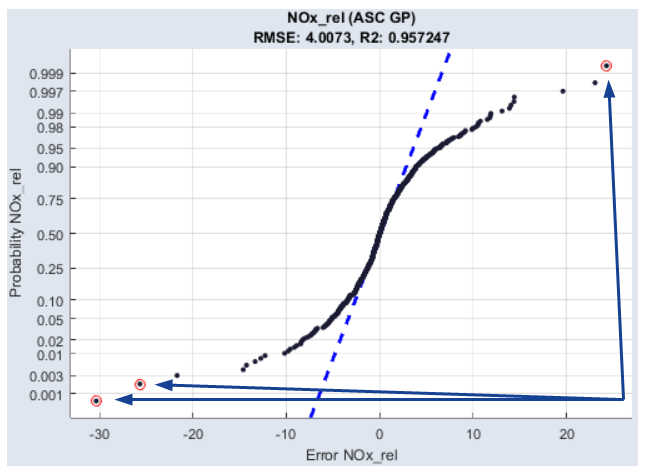
Fig. 11: Normal Probability Plot
The fact that it is the same measuring point can be verified by right-clicking on the respective point.
To remove individual or groups of outliers, proceed as follows.
-
In one of the plots that is opened with Model > Error (Leave-One-Out) > *, select one or several points by holding the left mouse button pressed and drawing up a rectangle over these points.
The selected points are highlighted in color.
- If necessary, select additional points by drawing up another rectangle.
-
To mark the points within a specific rectangle as outliers, right-click the edge of the particular rectangle and select Mark as Outlier in Selected/All Outputs.
You can undo this by selecting Unmark in Selected Output from the context menu.
-
To remove the selected measuring points from the set of training data, select Extras > Delete Marked Points and Retrain.
-
After removing the data, the models are retrained for the outputs.