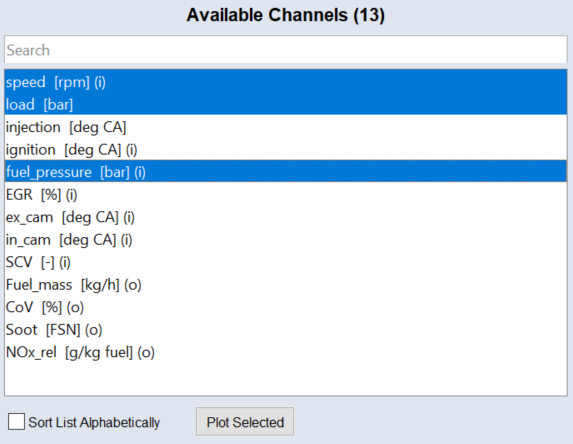
Graphical Plausibility Check
To check the training data again prior to the import, it is possible to graphically display the measuring data.
Displaying measuring data prior to the import
-
In the Available Channels field, select one or more measure variables.
-
Click Plot Selected or select Extras > Plot Selected.
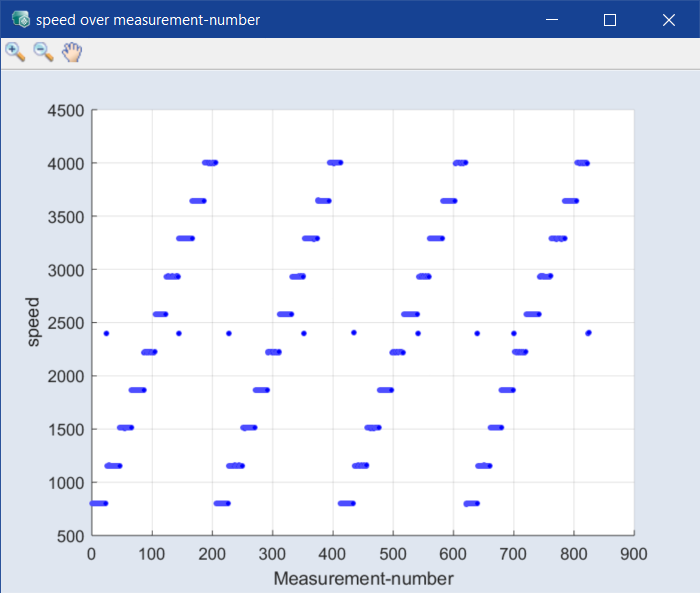
A window opens that displays the following (depending on the number of selected variables):
-
1 variable: measured data above number of measurement
-
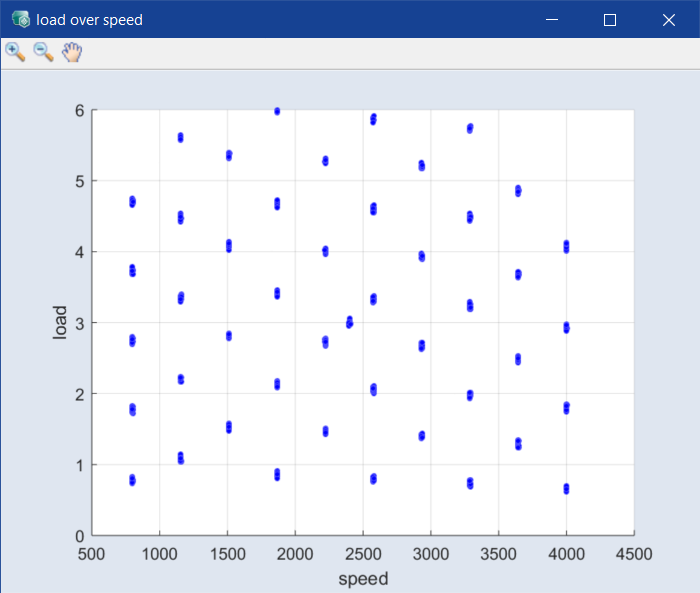
2 variables: data of one column above data of the other – e.g., load above speed.
-
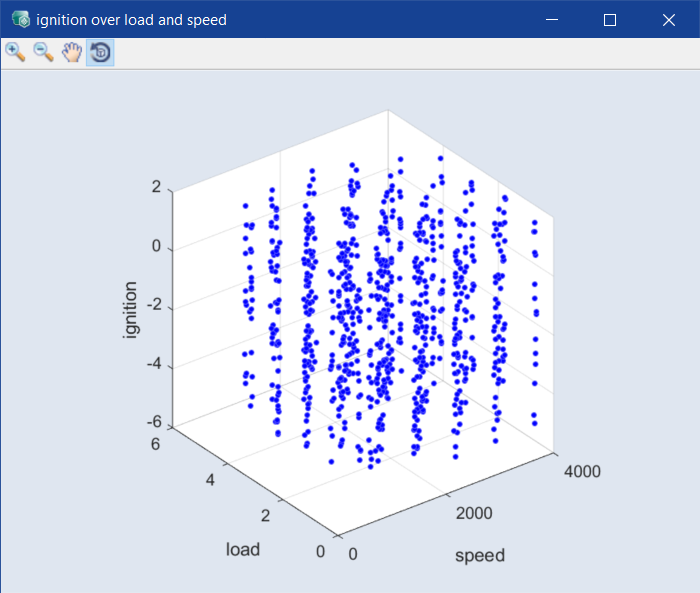
3 variables: data of the third column above the plane set up by the other two – e.g., ignition above the speed-load plane.
-
more than 3 variables: a series of scatter plots
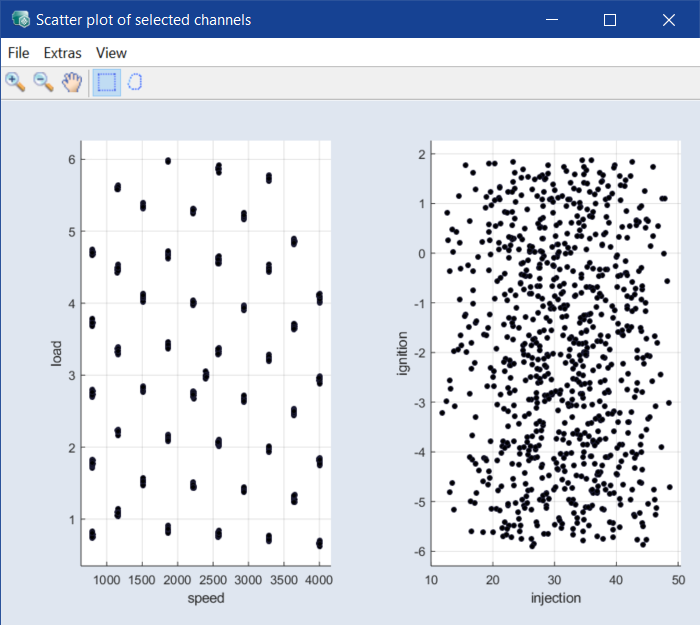
This window can be used, for example, to visualize the equal proportioning of the measuring data.
Note
Detailed instructions for handling such 3D plots are located in section Visualizing.