ASCMO-Scatter Plot
The standalone ASCMO-Scatter Plot offers the possibility to view n-dimensional data as a series of scatter plots without starting ASCMO-STATIC or ASCMO-DYNAMIC.
Using the standalone scatter plot tool
-
In the "ASCMO-DESK" window, click on Scatter Plot.
The "ASCMO Data Import" window and a file selection window open.
-
In the file selection window, enter or select path and name of the file you want to import.
You can import Excel (*.xls, *.xlsx) files and lists of comma-separated values (*.csv, *.txt).
-
Click on Open.
If the file contains several work sheets, the "Select Sheet" window opens.
-
In that window, select the desired work sheet and click on OK.
The content of the file is loaded into the "ASCMO Data Import" window. The data as well as the names of the measurement channels are displayed.
-
In the "Available Data" list, select the measurement channels you want to plot.
-
Click on Inputs.
The variables are added to the "Inputs" list.
-
Click on OK.
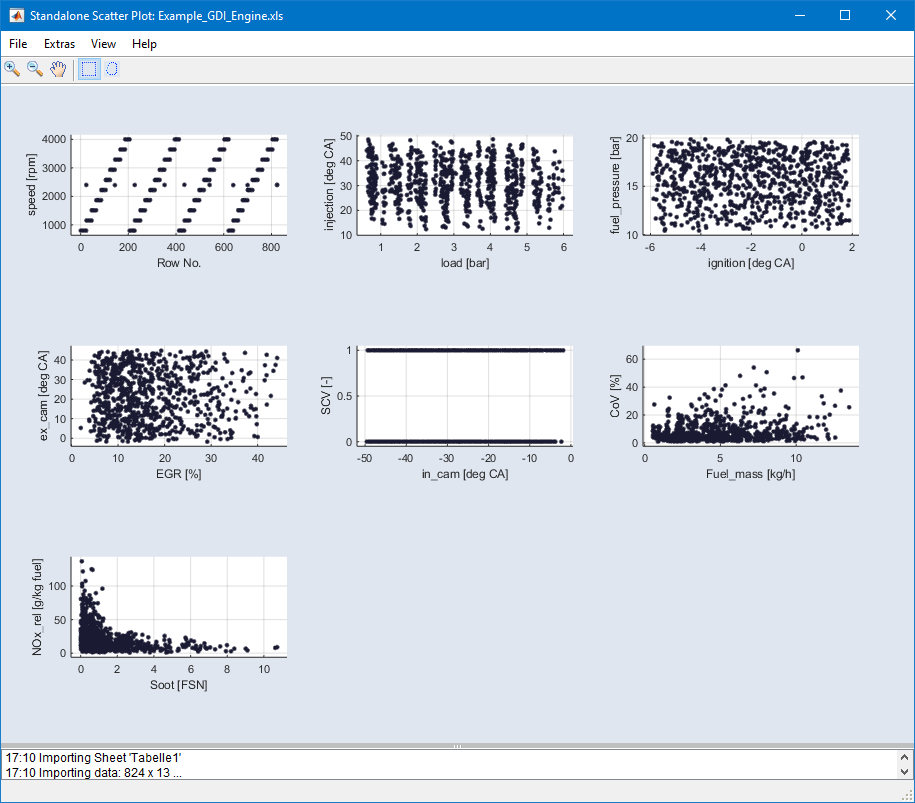
The
 "Standalone Scatter Plot" window opens. See
 -
If desired, select View → Select Axes and use the "Select Axes" window to select axes pairs for scatter plots.
See also