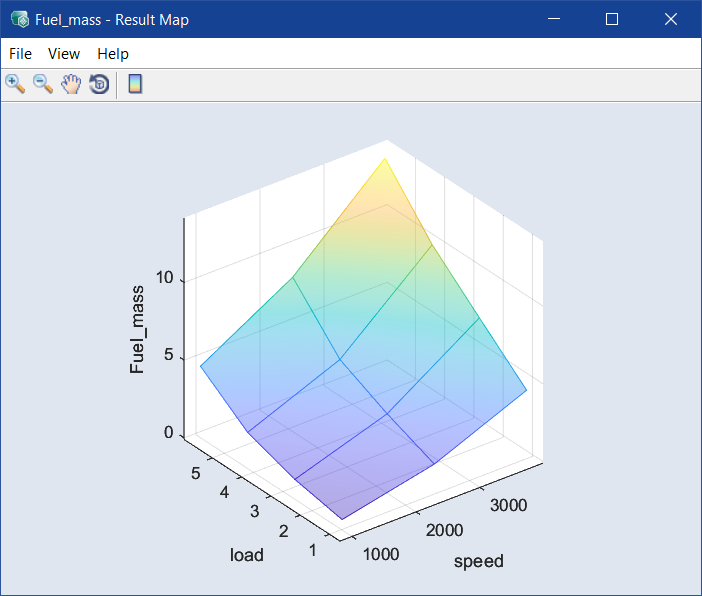
<output> Result Map
Calibration menu > Result Maps > <output>
The <output> Result Map window contains the following elements:
 File
File
-
Saves the map of this input as DCM or CSV file (<project name>_CM_<input>.*).
-
Copy to Clipboard
Copies the plot to the clipboard.
-
Save as Image
Saves the plot as a *.bmp, *.png, or *.jpg image.
-
Visible Z-Range
Opens the
Visible Z-Range window where you can change the display range of the Z-axis.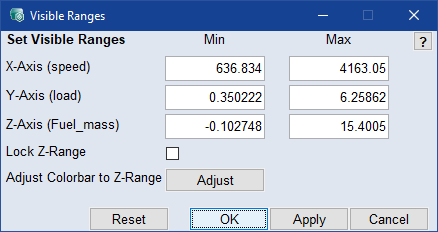
Note
The Adjust button is available only if the color bar is displayed.
-
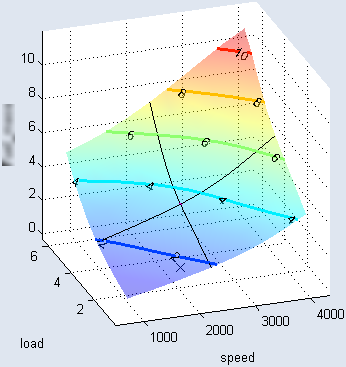
Contour Mode
Shows/hides the
contour lines in the plot.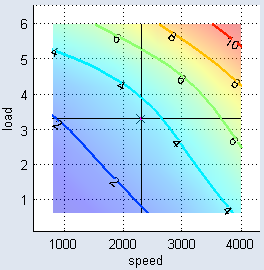
-
Contour Options
Note
Only available if Contour Mode is enabled.
Use the submenus to set up the contour lines.
Contour Properties
Opens the Contour Properties window where you can adjust the properties of the contour lines.
Set labels manually
Shows only the contour lines and offers a cross-hair cursor to insert labels. Click in the plot to enter a label at the cursor position.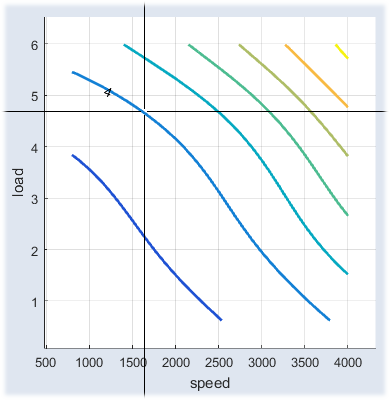
To end the insert mode, click outside the plot, or move the cursor outside the plot and press the<Esc> key.
-
Show Toolbar
Allows showing and hiding the toolbar of the window.
-
Show Cursor
Shows or hides the pink dot and black X that mark the selected operation point.
-
Prepare Print
Opens the
Prepare Print Options window where you can adjust the look of the plot area. The settings are reset when you close the plot window.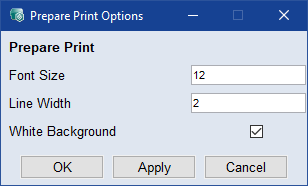
-
Show Single Result Bound
Shows (if available) the relevant criterion for the single-result optimization.
-
Show Global Optimization Bound
Shows (if available) the relevant criterion for global optimization.
-
Driving Cycle
Shows (if available) the driving cycle traces in the plot.
-
Show Sigma
Shows the value of sigma at the optimization points.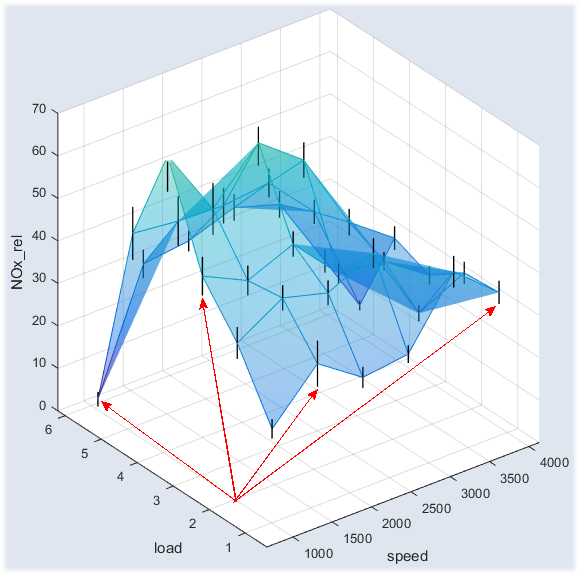
-
User Guide: Opens the PDF User Guide.
-
Online Help: Opens the online help (F1).
-
Interface Help: Opens the interface help.
-
License: Opens the ETAS License Manager.
-
Support: Displays contact information for various ETAS support channels.
-
Safety Advice: Opens the ETAS safety advice.
-
About: Opens the About window, where you can also get information about OSS used in ASCMO.
The toolbar of the <output> - Result Map window contains the following elements:

|
Zoom In | Clicking in the plot will enlarge the plot representation. |

|
Zoom Out | Clicking in the plot will reduce the plot representation. |

|
Pan | Thus, the plot can be shifted within the window. |

|
Rotate 3D | Thus the 3D plot can be rotated in all three spatial directions. |

|
Insert Colorbar | Displays the current color table with the axis scaling. |
Plot area
Displays the 3D plot of the respective output result map.