Repetition Point Analysis
Data menu > Repetition Point Analysis
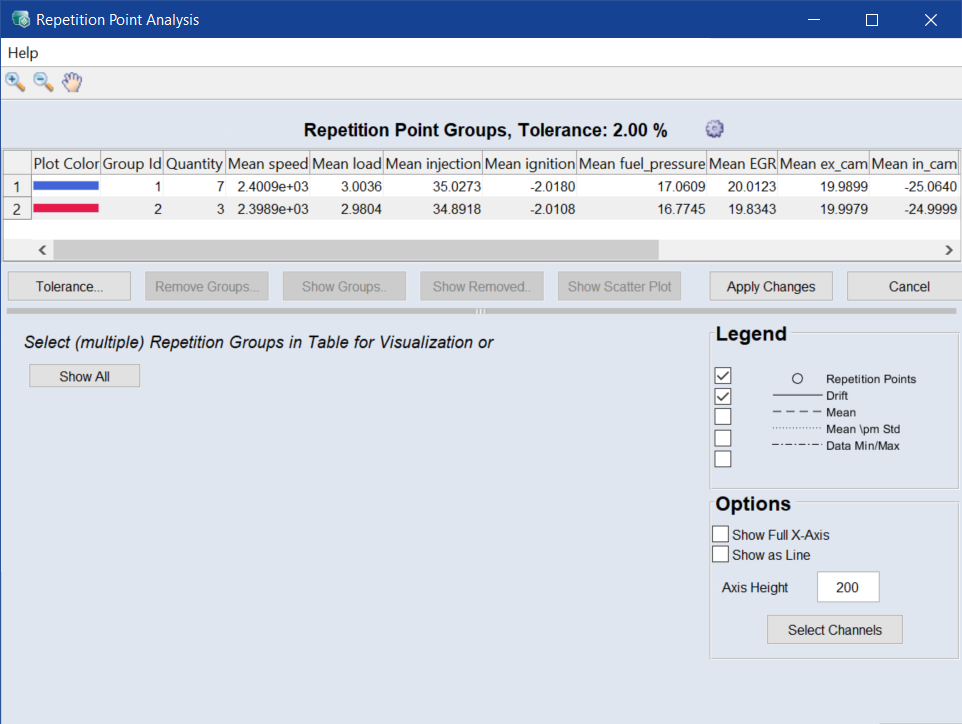
This window displays the determined groups of duplicate points (based on a specified tolerance value).
Each of the groups is named by an identifier (Repetition Point Group ID), the Quantity column contains the number of points in this group, and the subsequent columns contain the means of the points.
The Repetition Point Analysis window contains the following elements:
The gear symbol ![]() and Tolerance button open the Detection Threshold and Input Selection window, which provides the following functions:
and Tolerance button open the Detection Threshold and Input Selection window, which provides the following functions:
-
Define the value (in percent) for the recognition of duplicate points.
The tolerance for the repetition detection in percent (Normalized Radius [%]) here refers to the highest possible distance of two points. For the calculation of the distance, the values of the X-Axis (min/max) are scaled to 0..1.
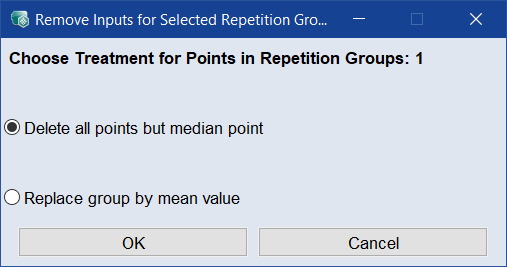
Opens the  Remove Inputs for Selected Repetition Groups window. Select one or multiple groups and specify the method on how to replace the determined set of points in the Remove Inputs for Selected Repetition Groups window.
 Show Groups
Shows the repetition groups.
Show Removed
Shows the removed points.
Show Scatter Plot
Shows a scatter plot.
The change of the measured values of the outputs (as a function of the index of the measuring point in the dataset) are displayed in a plot. Select which elements should be displayed in the plot with the checkboxes.
Apply Changes
Closes the window and applies your settings.
Cancel
Discards your settings and closes the window.