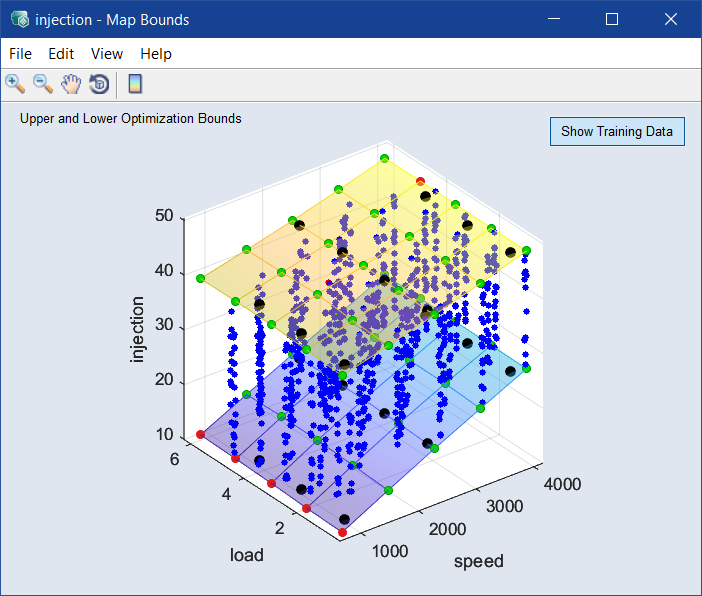
<input> - Map Bounds
Calibration menu > Map Bounds over OP.
The <input> - Map Bounds window contains the following elements:
The bounds are edited in the Edit menu.
With Show Training Data, you can enable/disable the display of the data used for the model training.
 File
File
-
Export
Saves the map bounds of this input as DCM or CSV file (<project name>_CM_<input>.*).
-
Import
Imports map bounds with the restriction of parameter variation from a file (*.dcm/*.xls/*.xlsx/*.xlsm/*.csv/*.ascmo).
-
Copy to Clipboard
Copies the plot to the clipboard.
-
Save as Image
Saves the plot as a *.bmp, *.png, or *.jpg image.
-
Close
Closes the window.
Edit
-
Grid Nodes
Opens the
Change Grid Node Map Bounds window, where you can set the position and the number of the nodes for the grid.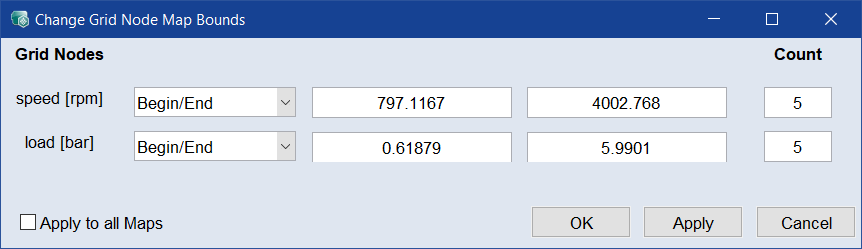
If Begin/End is selected, the min. and max. values of the axis nodes can be set. The remaining nodes are evenly distributed in between.
If you know the location of the grid nodes to be matched, these can be specified precisely. To do this, select Support Vector in the drop-down list. Then the axis vectors of the chosen map will be displayed and can be changed. The number of interpolation points is then automatically activated in the Count column.
If the Apply to all maps checkbox is enabled, the changes are applied to all <Input> - Map Bounds maps.
-
Set Grid to OPs
Adopts the raster of operating points as grid nodes for the current map.
-
Fit Bounds to Data
Fits the bounds of the current map to the measured data via the
Fit Map Bounds To Data window. 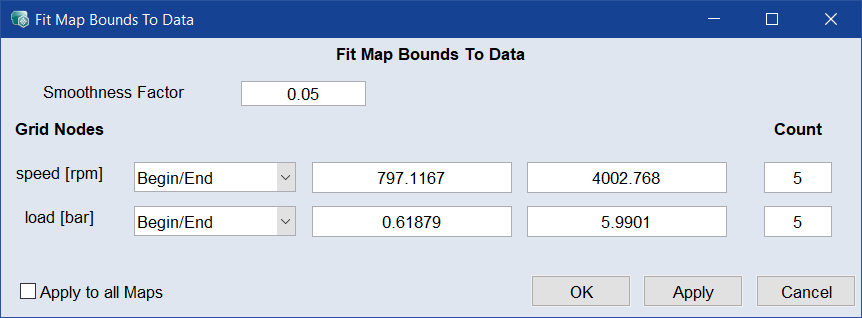
You can enter a smoothness factor for the map bounds. You can use the current grid or define a new one.
If the Apply to all maps checkbox is enabled, the changes are applied to all <Input> - Map Bounds maps.
-
Fit Bounds to Min/Max
Sets the bounds to the minimum and maximum value of the input.
-
Scale and Shift
Opens the
Scale and Shift Bound Map <Input> window.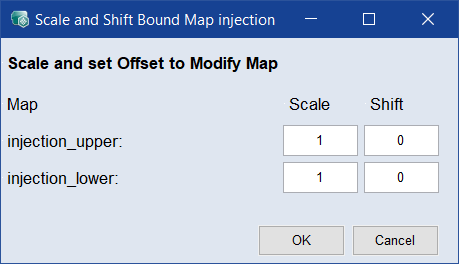
Here, you can extend the bounds by entering the a value for scaling and shifting in the Scale and Shift fields for each of the lower or upper limits.
-
Set all Grid to OPs
Adopts the raster of operating points as grid nodes for all maps.
-
Opens the
Bounds '<input>' window that shows a table with the upper and lower bounds of the input. The values of the bounds can be edited here.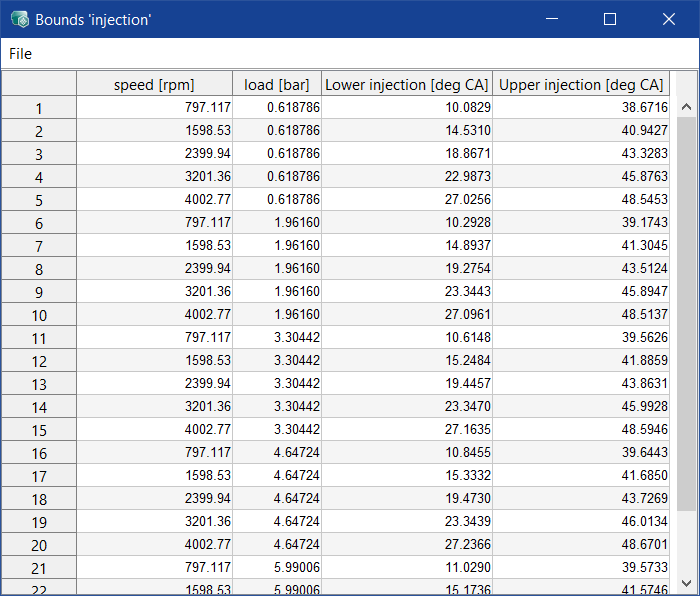
The
File menu provides the following menu options:-
Plot Selected Data
Shows the previously selected data in a plot window. Make sure that you select data from two or three columns.
-
Show Current Row in ISP View
Sets the selected table row in the ISP view.
-
Import
Imports an existing table of bounds from an Excel (*.xls/*.xlsx/*.xlsm) or *.csv file
-
Export
Saves the table of bounds to an Excel (*.xls/*.xlsx) or *.csv file.
-
Close
Closes the window.
-
View
-
Update Intersection Plot Online
If this checkbox is enabled and you select an operating point in the <input> - Map Bounds window, it is automatically set in the ISP view.
-
Show Calibration Map
The map of the corresponding calibration map is shown in the plot.
-
Visible Z-Range
Opens the
Visible Z-Range window where you can change the display range of the Z-axis.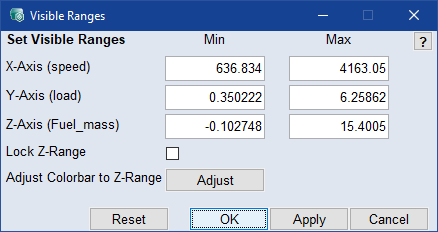
Note
The Adjust button is available only if the color bar is displayed.
-
Show Toolbar
Shows/hides the toolbar of the window.
-
User Guide: Opens the PDF User Guide.
-
Online Help: Opens the online help (F1).
-
Interface Help: Opens the interface help.
-
License: Opens the ETAS License Manager.
-
Support: Displays contact information for various ETAS support channels.
-
Safety Advice: Opens the ETAS safety advice.
-
About: Opens the About window, where you can also get information about OSS used in ASCMO.
Toolbar
The toolbar of the window contains the following elements:

|
Zoom In | Clicking in the plot will enlarge the plot representation. |

|
Zoom Out | Clicking in the plot will reduce the plot representation. |

|
Pan | Thus, the plot can be shifted within the window. |

|
Rotate 3D | Thus the 3D plot can be rotated in all three spatial directions. |

|
Insert Colorbar | Displays the current color table with the axis scaling. |
 Show Training Data
Enables/disables the display of the data used for the model training.
Plot area
Displays a 3D plot of the upper and lower bounds of the <input> calibration map.