Probability Plot (<method>)
Model menu > Error (Leave-One-Out / Test or Training Data) > Probability Plot
|
Note |
|---|
|
The description of this window refers to the error that is based on the Leave-One-Out method – but it applies analogously to the errors based on training or test data. |
Two windows open: One window contains the normal probability plots, the other window the histograms of the absolute deviations between measurement and model of the output variables.
The probability plot shows whether the deviations plotted on the X-axis feature a normal distribution.
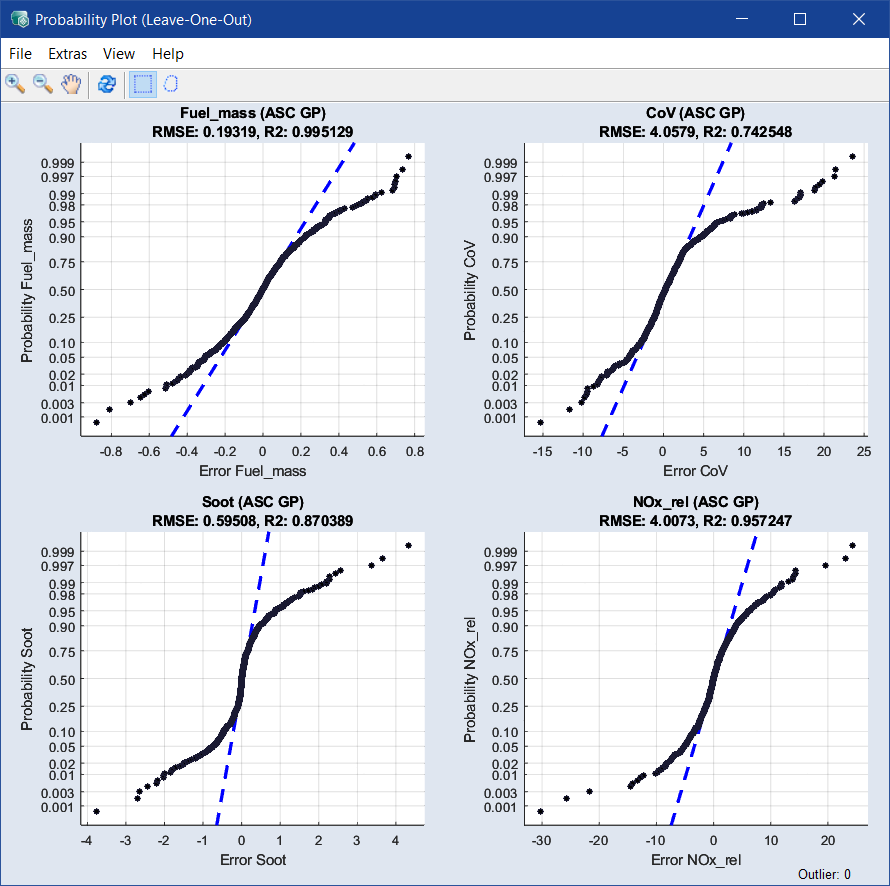
A straight line represents a normal distribution (through a special scaling of the Y-axis) (blue dashed line).
The functions of the menus and the context menu of the individual plots are described in Scatter Plot .
The other window shows the histograms that match the standard plots.
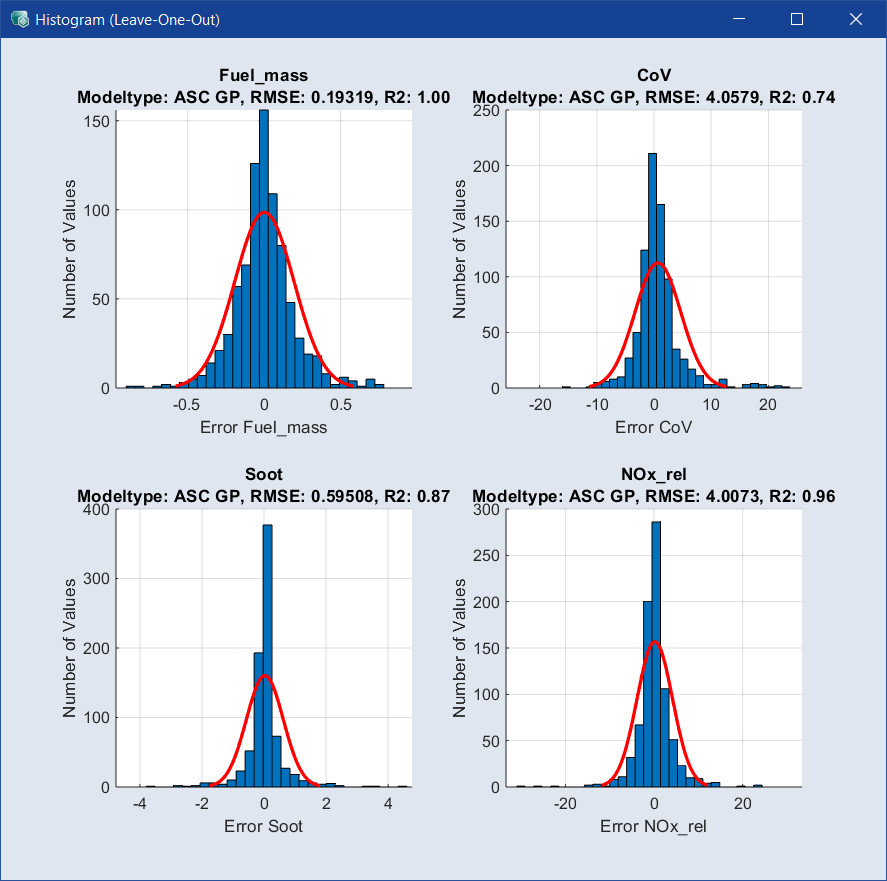
This window cannot be used to mark outliers and is used primarily as a supplement to increase the meaningfulness of the standard plot. In addition to the actual distribution of the error (blue bars), the normal distribution (red line) is drawn in.