Error vs. Output (Leave-One-Out)
Model menu > Error (Leave-One-Out)> Error vs. Output
|
Note |
|---|
|
The description of this window refers to the error that is based on the Leave-One-Out method – but it applies analogously to the errors based on training or test data. |
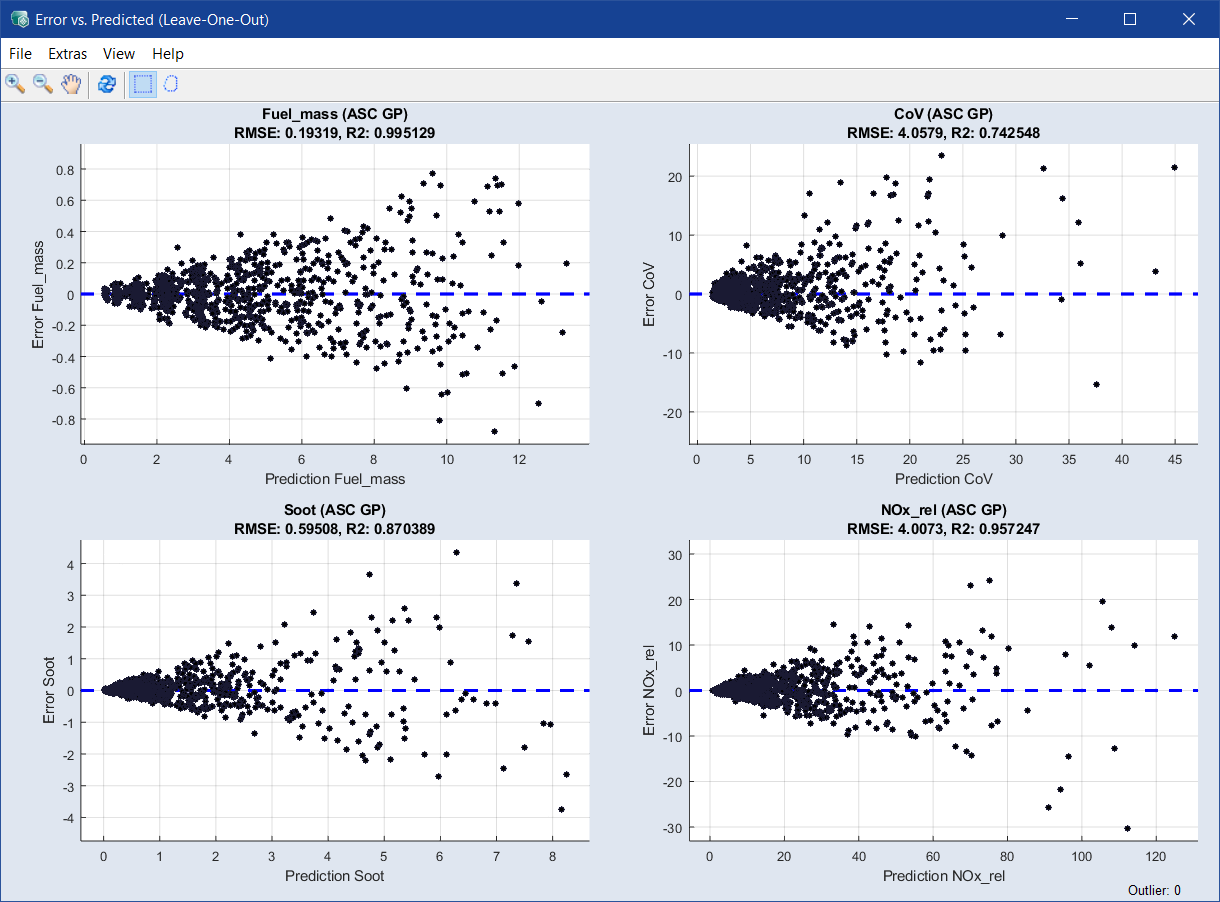
In each plot, the measuring points are depicted on the X axis and the absolute deviation between measurement and model output (for the respective measuring point) on the Y axis.
The blue dashed line once again indicates the target state (lowest possible deviation between measurement and model). This representation is another possibility of assessing the model quality and recognizing outliers.
The functions of the menus and the context menu of the individual plots are described in Scatter Plot .