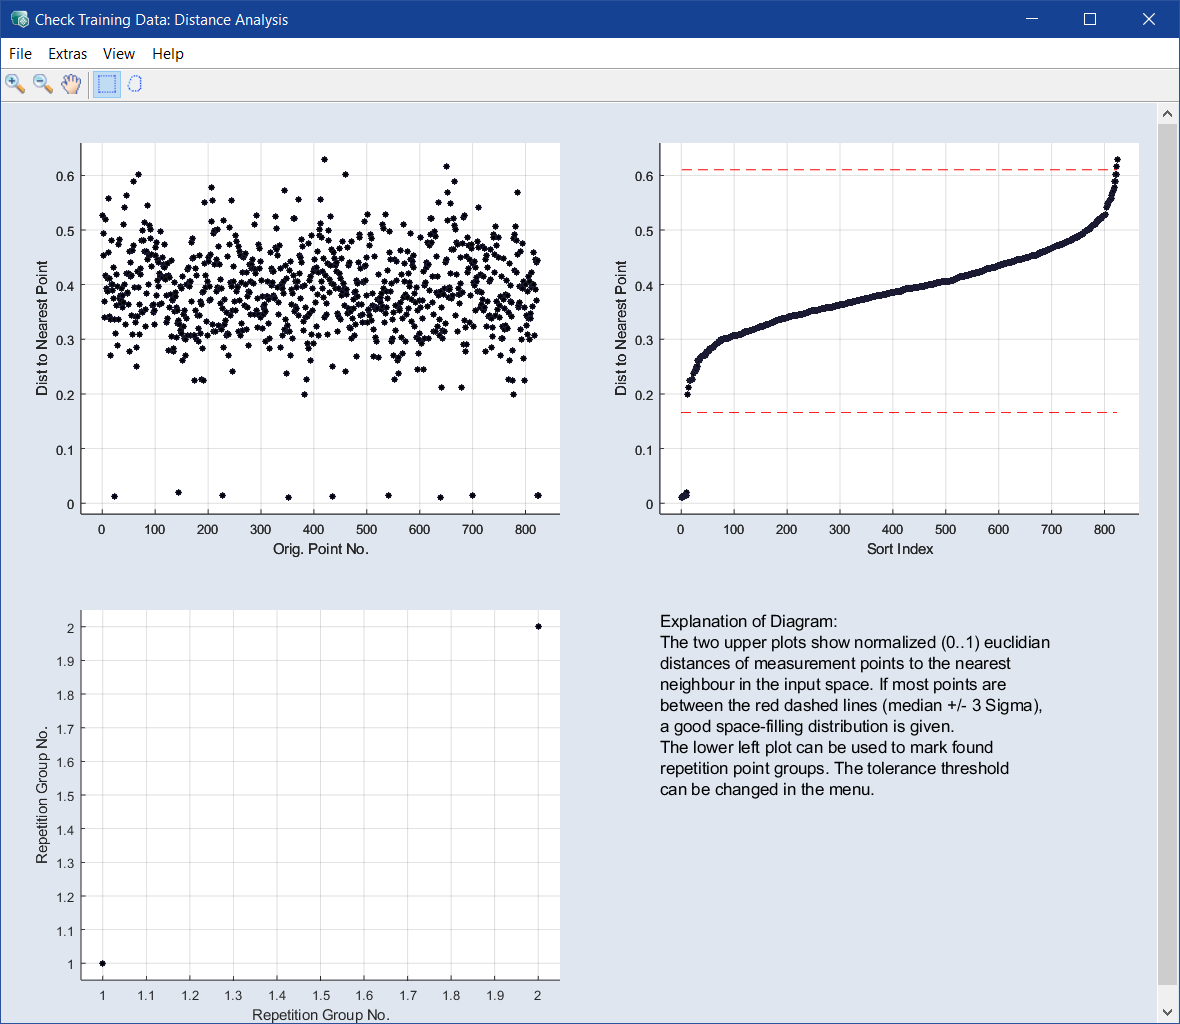
Check Training Data: Distance Analysis
Data menu > Check Training Data > Extras menu > Show Distance Analysis
The meaning of the plots in the Check Training Data: Distance Analysis window is explained in the lower-right field.
The Check Training Data: Distance Analysis window contains the following elements:
 File
File
-
New
|
Unavailable in some scatter plot windows.
|
Opens the Select Axes window where you can select axes pairs to be plotted in an additional window.
-
Export All Data
Exports all data points into an Excel (*.xls, *.xlsx), CSV (*.csv), MDF3 (*.dat) or MDF4 (*.mf4) file.
-
Export Intersection of Selected Data
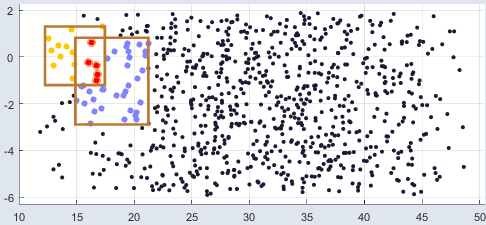
Exports the data points in the overlap area of all rectangles into an Excel (*.xls, *.xlsx), CSV (*.csv), MDF3 (*.dat) or MDF4 (*.mf4) file. These data points appear as red dots in the scatter plot.
If there is no area where all rectangles overlap, or if the overlap area of all rectangles is empty, there are no data points that can be exported.
-
Export Union of Selected Data
Exports the data points in all rectangles, i.e. all colored dots in the scatter plot, into an Excel (*.xls, *.xlsx), CSV (*.csv), MDF3 (*.dat) or MDF4 (*.mf4) file.
This export function works for overlapping and non-overlapping rectangles.
-
Close
Closes the window.
Extras
-
Mark Points in Intersection
Points in the intersection of all rectangles will be marked for deletion.
-
Delete Marked Points / Retrain
Deletes all points marked in any of the plots, saves the dataset and starts a new model training.
-
Show Distance Analysis
Opens/closes the Check Training Data: Distance Analysis window.
-
Set Tolerance of Duplicate Detection
Opens the Distance Analysis window where you can change the distance used for duplicate detection. All points that have a shorter distance to their adjacent neighboring point as specified here, are seen as duplicate points.
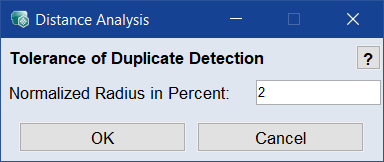
The Tolerance for the duplicate detection in percent Normalized Radius in Percent here regards to the highest possible distance of two points (sqrt(D)). For the calculation of the distance, the values of the X-Axis (min/max) will be scaled to 0..1. The indicated distances are then obtained from sqrt (sum(delta x_i)).
-
Delete Duplicate Points
Deletes all data recognized as duplicate points from the training data.
View
-
Plot Settings
Opens the Edit Axes window where you can set the minimal size of the plots in pixel. If you change the size and click OK or Apply, each scatter plot smaller than the new values is adapted automatically.
|
The information in the Edit Axes window will be saved in ASCMO-STATIC and used in all scatter plots.
|
-
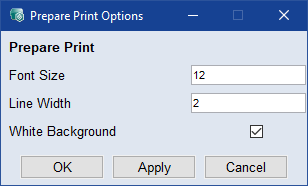
Prepare Print
Opens the Prepare Print Options window where you can adjust the look of the plot area. The settings are reset when you close the plot window.
-
Save as Bitmap
This allows the content of the window to be saved in a series of graphic formats.
-
Copy to Clipboard
Copies the window content to the clipboard.
-
Update
Updates the plots in the window.
Help
-
User Guide: Opens the PDF User Guide.
-
Online Help: Opens the online help (F1).
-
Interface Help: Opens the interface help.
-
License: Opens the ETAS License Manager.
-
Support: Displays contact information for various ETAS support channels.
-
Safety Advice: Opens the ETAS safety advice.
-
About: Opens the About window, where you can also get information about OSS used in ASCMO.
The points in the scatter plots offer the following context menu.
-
Index: <n> | Value: [<x> <y>]
Shows the index number (= row number in the table of the Edit Training Data window) and the values of the selected point.
-
Show Point in Intersection Plot
The data point selected in the plot is displayed in the ISP view.
-
Mark (in the All Outputs area)
The data point is marked for deletion in all outputs.
Toolbar