Driving Cycles Scatter Plot and Driving Cycles Time
Calibration menu > Driving Cycles >  Scatter Plot
-
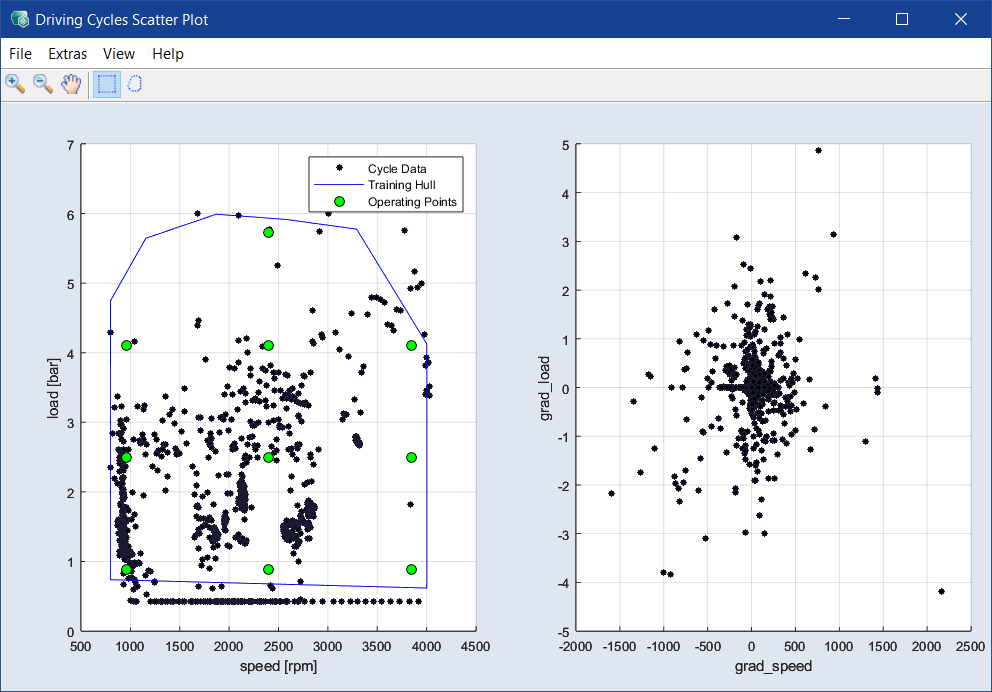
The Driving Cycles Scatter Plot window shows scatter plots of the operating point axes and the gradients of the selected driving cycles.
-
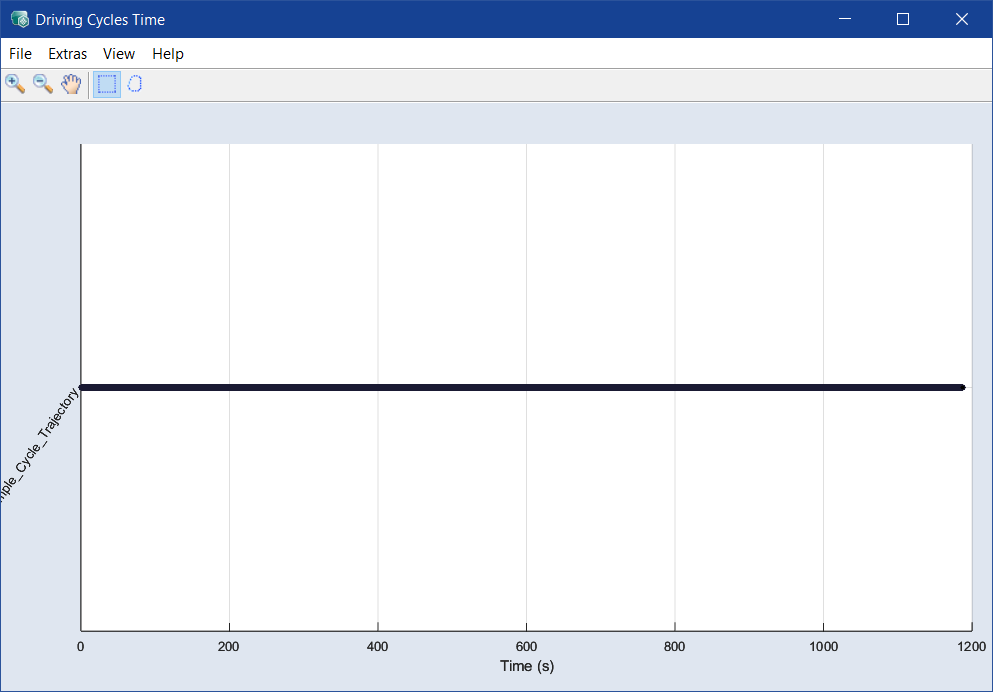
The Driving Cycles Time window opens, too, when you open the Driving Cycles Scatter Plot window.
Note that you can draw a rectangle like in all scatter plots - either in the Driving Cycles Scatter Plot or in the Driving Cycles Time window - to select points.
Both windows contain the identical menus and toolbars:
-
New
Note
Unavailable in some scatter plot windows.
Opens the Select Axes window where you can select axes pairs to be plotted in an additional window.
-
Export All Data
Exports all data points into an Excel (*.xls, *.xlsx), CSV (*.csv), MDF3 (*.dat) or MDF4 (*.mf4) file.
-
Export Intersection of Selected Data
Exports the data points in the overlap area of all rectangles into an Excel (*.xls, *.xlsx), CSV (*.csv), MDF3 (*.dat) or MDF4 (*.mf4) file. These data points appear as
 red dots in the scatter plot.
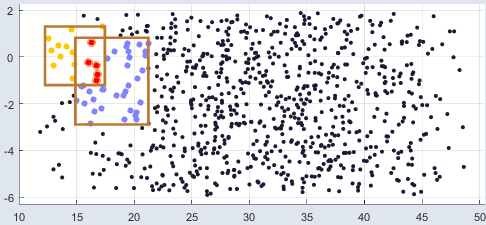
If there is no area where all rectangles overlap, or if the overlap area of all rectangles is empty, there are no data points that can be exported.
-
Export Union of Selected Data
Exports the data points in all rectangles, i.e.
all colored dots in the scatter plot, into an Excel (*.xls, *.xlsx), CSV (*.csv), MDF3 (*.dat) or MDF4 (*.mf4) file. This export function works for overlapping and non-overlapping rectangles.
-
Close
Closes the window.
-
Remove all Rectangles
Deletes all rectangles in the current window.
-
Delete Points in Intersection
Deletes all measurement points out of the respective rectangle.
-
Delete Points Outside Training Hull
Deletes all measurement points located outside the training hull.
-
Select Axes
Opens the Select Axes window where you can select the axes pairs to be plotted.
-
Plot Settings
Opens the Edit Axes window where you can set the minimal size of the plots in pixel. If you change the size and click OK or Apply, each scatter plot smaller than the new values is adapted automatically.
Note
The information in the Edit Axes window will be saved in ASCMO-STATIC and used in all scatter plots.
-
Prepare Print
Opens the
Prepare Print Options window where you can adjust the look of the plot area. The settings are reset when you close the plot window.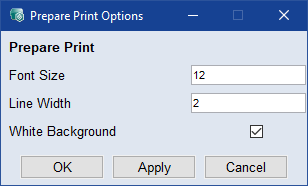
-
Save as Bitmap
This allows the content of the window to be saved in a series of graphic formats.
-
Copy to Clipboard
Copies the window content to the clipboard.
-
Update
Updates the plots in the window.
-
User Guide: Opens the PDF User Guide.
-
Online Help: Opens the online help (F1).
-
Interface Help: Opens the interface help.
-
License: Opens the ETAS License Manager.
-
Support: Displays contact information for various ETAS support channels.
-
Safety Advice: Opens the ETAS safety advice.
-
About: Opens the About window, where you can also get information about OSS used in ASCMO.
This table shows a selection of possible toolbar buttons.
|
|
Zoom in |
By clicking in the plot, the visualization becomes larger. |
|
|
Zoom out |
By clicking in the plot, the visualization becomes smaller. |
|
|
Pan |
This allows you to move the plot within the window. |
|
|
Mouse selection in plot with rectangle |
Sets the selection tool in the scatter plots to a rectangle. |
|
|
Mouse selection in plot with lasso |
Sets the selection tool in the scatter plots to a lasso. |
|
|
Update |
Updates the plots in the window. |


See also