3D Plot
In/Outputs menu > 3D Plot Outputs
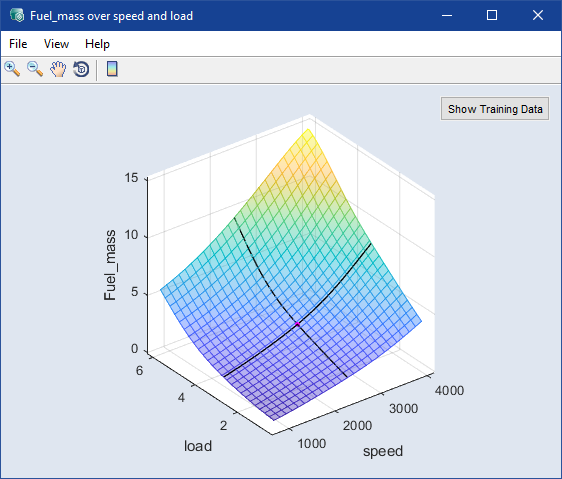
The 3D plot window (named, e.g., "<output> over <input1> and <input2>") contains the following elements:
Copy to Clipboard
Copies the plot to the clipboard.
Save as Image
Saves the plot as a *.bmp, *.png, or *.jpg image.
Close
Closes the 3D plot window.
Show Training Data
If this option is enabled, the training data are shown in the plot.
Show Training Data Bounds
If this option is enabled, the lower and upper limits of the training data are shown in the plot.
Constrain Graphic to Hull
Limits the graph to the convex hull of the training data.
If you select only Constrain Graphic to Hull, the area outside the hull is invisible.
If you select Constrain Graphic to Hull and Contour Mode, the area outside the hull is faded.
Opens the  Visible Ranges window where you can change the visible range of the axes.
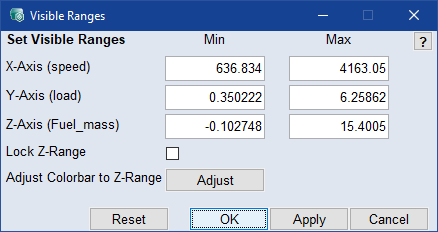
Set the minimum and maximum visible range of the axes in the respective input fields.
Activate the Lock Z-Range checkbox to lock the visible range of the Z axis.
|
Note |
|---|
|
The Adjust Colorbar to Z-Range button is available only when the color bar is displayed. |
Use the Reset button to return to the default settings.
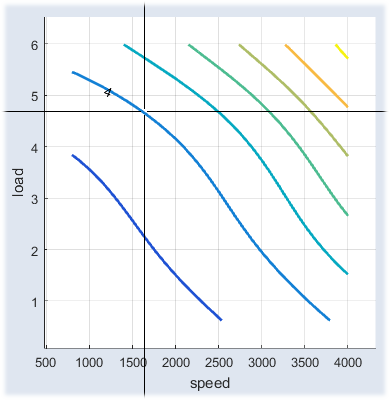
Contour Mode
Enable/disable the contour lines in 3D plots.
Contour Options
|
Note |
|---|
|
Only available if Contour Mode is enabled. |
Use the submenus to set up the contour lines.
|
Contour Properties |
Opens the Contour Properties window where you can adjust the properties of the contour lines. |
|
Set labels manually |
To end the insert mode, click outside the plot, or move the cursor outside the plot and press the <Esc> key. |
Show Toolbar
Shows or hides the toolbar.
Show Cursor
Shows or hides the black lines that mark the selected operation point.
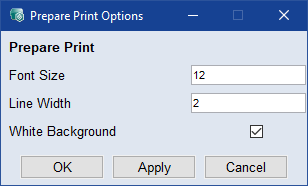
Prepare Print
Opens the Prepare Print Options window where you can adjust the look of the plot area. The settings are reset when you close the plot window.
-
User Guide: Opens the PDF User Guide.
-
Online Help: Opens the online help (F1).
-
Interface Help: Opens the interface help.
-
License: Opens the ETAS License Manager.
-
Support: Displays contact information for various ETAS support channels.
-
Safety Advice: Opens the ETAS safety advice.
-
About: Opens the About window, where you can also get information about OSS used in ASCMO.
The toolbar of the window contains the following elements.

|
Zoom In | Clicking in the plot will enlarge the plot representation. |

|
Zoom Out | Clicking in the plot will reduce the plot representation. |

|
Pan | Thus, the plot can be shifted within the window. |

|
Rotate 3D | Thus the 3D plot can be rotated in all three spatial directions. |

|
Insert Colorbar | Displays the current color table with the axis scaling. |
 Show Training Data
Shows the training data in the plot.