Training/Test Model Error: Predicted vs. Measured
Extras menu > Signal Trace Modeling > Open Viewer > Model menu > Model Error > Training Data
The Signal Trace Model allows a prediction of a signal trace (Predicted). The Measured curve corresponds to the measured data of the curve. So you can display the average model error (RMSE) for each signal evaluate the model. The test data can only be displayed if the entire dataset was not imported as training data previously.
The Training/Test Model Error: Predicted vs. Measured window contains the following elements:
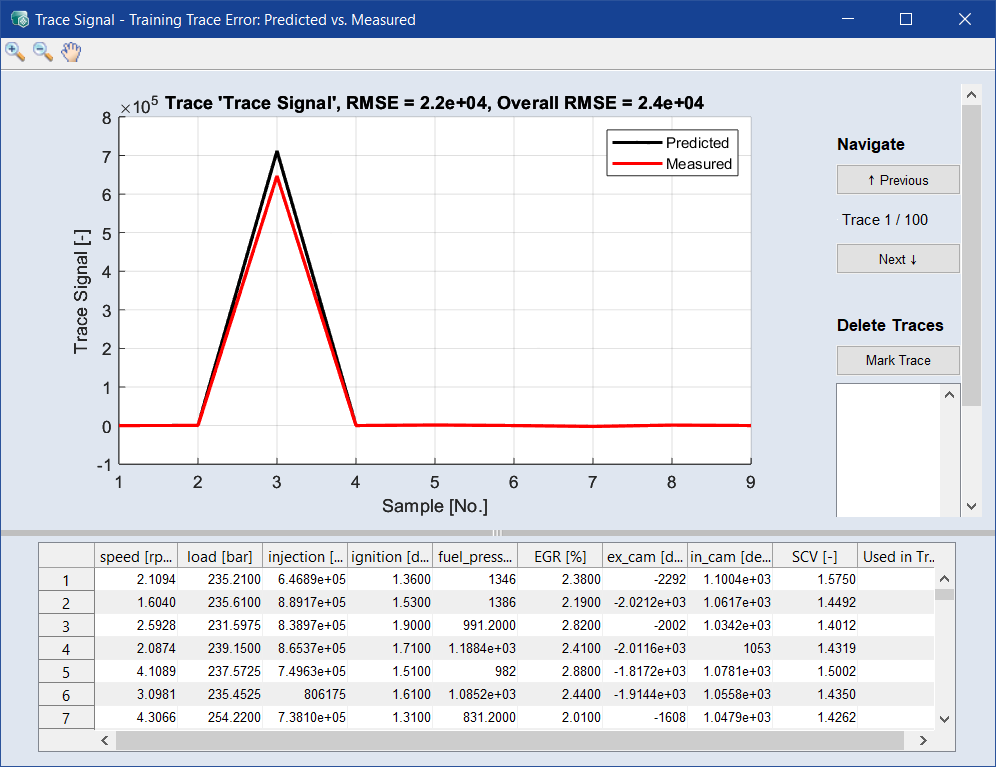
Navigate
With Previous and Next you can change the individual lines of the training/test data and then check each of the model prediction sigma.
|
Note |
|---|
|
If you change the rows of training/test data with Previous and Next, the selected row is not highlighted. The selected row is displayed between the Previous and Next button. |
Mark Traces
The Mark Traces field enables you to add or mark traces. You have to select a value in the desired row and click Mark Trace. The selected trace/row appears in the Mark Trace field.
|
Note |
|---|
|
Marked traces are displayed with a gray background in the error plot. |
The signal of the selected trace will be visualized by clicking on the traces. In this case you can also remove the traces from the Mark Traces field by clicking Unmark Trace.
If you click Delete and Retrain, the marked traces are deleted and the signal is trained again without the deleted traces. In addition, the number of the original traces, which is shown under Navigate, is reduced.
You can also save and export the traces as an Excel table (*.xlsx) by selecting a trace and then clicking Export.