Scope View
Analysis > Scope View > * or via the
  Scope View for Training Data button.
The Scope View window contains the following elements:
File
-
Export Data
Exports the data to an Excel (*.xlsx, *.xls), CSV (*.csv), MDF3 (*.dat) or MDF4 (*.mf4) file.
-
Close
Closes the Scope View window.
View
-
Signal Selection
Opens the "Scope Signal Selection" window, where you can assign the desired axes to scopes.
-
Set Time Range
Opens the "Set Time Range" window, where you can specify the range of the time axis.
-
Save View/Save View As
Saves the current Scope View.
Saved View can be opened via View → Load View within Scope View or My Views within ASCMO-MOCA Main Menu. -
Load View
Opens saved views, where you can select one to display.
-
Remove Saved View
Removes the current, saved Scope View.
Toolbar
|
|
Zoom In |
By clicking in the plot, the visualization becomes larger. |
|
|
Zoom Out |
By clicking in the plot, the visualization becomes smaller. |
|
|
Pan |
This allows you to move the plot within the window. If you shift a plot along the x axis, all plots are shifted. If you shift a plot along the y axis, only this plot is shifted. |


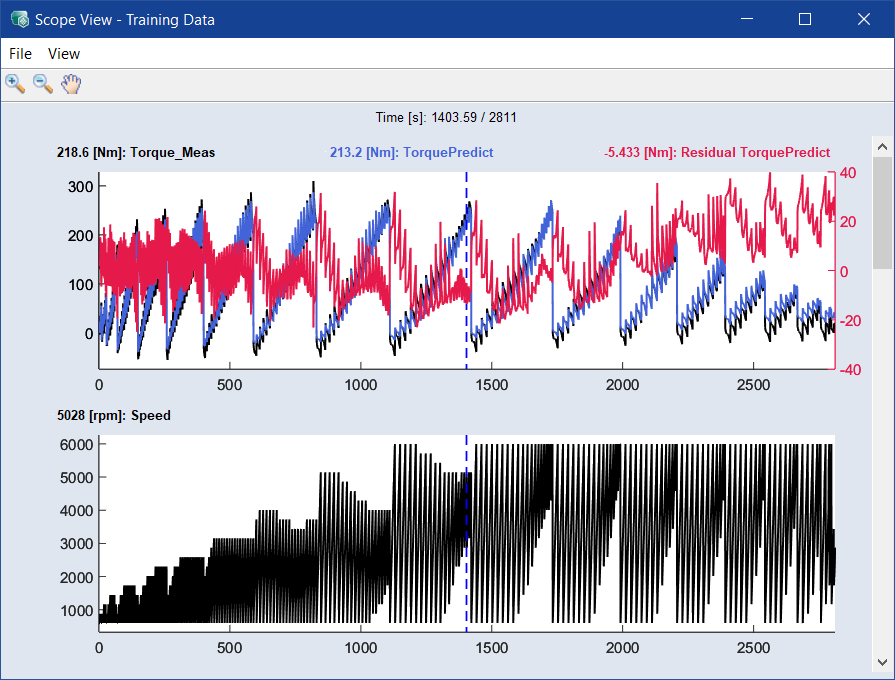
Plot Area
In the plot area, the static data is plotted over the time (example). If you assign several variables to one scope, each variable is plotted in a different color (see the first scope in the example).
See also