Parameter Correlation
Analysis menu > Parameter Correlation
The Parameter Correlation window contains the following elements:
Toolbar
|
|
Zoom In |
Clicking in the plot will enlarge the plot representation. |
|
|
Zoom Out |
Clicking in the plot will reduce the plot representation. |
|
|
Pan |
Thus, the plot can be shifted within the window. |
|
|
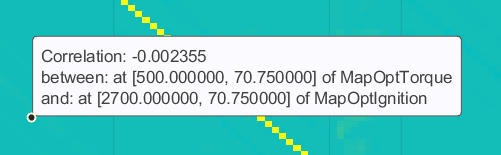
Data Cursor |
Activates the data cursor. Click in the plot to open a |
|
|
Insert Colorbar |
Displays the current color table with the axis scaling. 1 means strong positive correlation, 0 means no correlation, -1 means strong negative correlation. |
|
|
Update content of figure |
Updates the plot. |
|
|
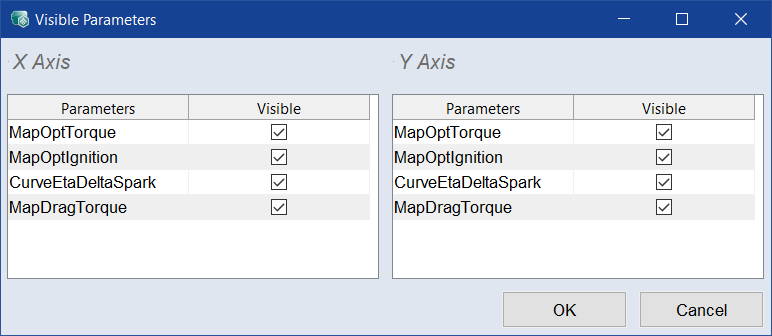
Configure displayed items |
Opens the |


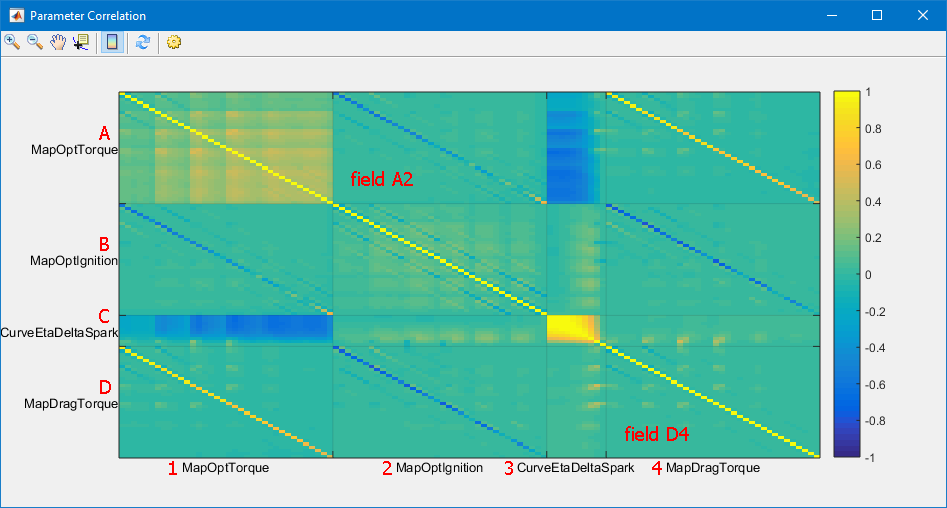
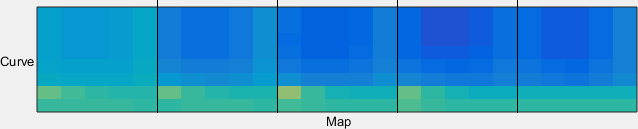
Plot area
This area shows the correlation plots for all model parameters.
By default, each parameter is shown on both axes. A right-click on a parameter name removes that parameter from the respective axis. A (left-)click on a parameter name removes the other parameters from the respective axis. Right- or left-clicking the last parameter name on an axis displays all parameters.
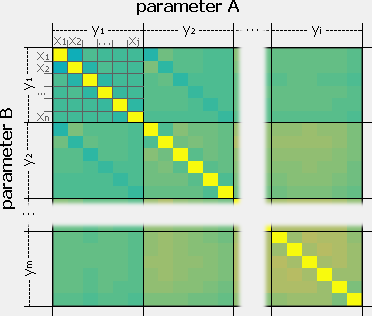
Each field in the plot (A2, D4, ...) shows the correlation between the respective parameter elements. A field is structured  as follows.
-
Selection Style
Use the submenu options to determine the way the spot is selected.
-
Display Style
Use the submenu options to determine the way the datatip is displayed.
-
Create New Datatip
Use this context menu option, or press <Shift> while clicking, to open another datatip.
-
Delete Current Datatip
Closes the selected datatip.
-
Delete All Datatips
Closes all datatips.
See also